In the modern manufacturing industry, customer feedback is not just a formality—it’s a goldmine of insights. If used strategically, it can shape your production quality, enhance operational efficiency, and foster lasting customer relationships. That’s where the Manufacturing Customer Feedback KPI Dashboard in Excel comes in.
This powerful, ready-to-use dashboard allows manufacturing companies to effectively monitor and measure key performance indicators (KPIs) related to customer feedback. In this comprehensive article, we’ll walk you through everything you need to know about this tool—from its structure to its strategic benefits and best practices.
Click to Purchase Manufacturing Customer Feedback KPI Dashboard in Excel
What is a Manufacturing Customer Feedback KPI Dashboard?
A Manufacturing Customer Feedback KPI Dashboard is an Excel-based tool designed to capture, analyze, and visualize performance metrics derived from customer feedback. These metrics help businesses:
- Monitor customer satisfaction
- Track recurring complaints or product issues
- Identify opportunities for process improvements
- Align customer expectations with manufacturing goals
Instead of working with scattered reports or spreadsheets, this dashboard provides a centralized, automated solution that simplifies decision-making for plant managers and quality assurance teams.
Why Use Excel for Manufacturing KPIs?
Although there are numerous software tools in the market, Excel remains a reliable favorite due to its:
- Flexibility
- Customizability
- Familiarity among users
- No additional cost
Moreover, Excel’s advanced formulas, conditional formatting, and data visualization options make it ideal for creating interactive KPI dashboards.
Overview of the Manufacturing Customer Feedback KPI Dashboard
This dashboard is thoughtfully organized into seven key worksheet tabs, each serving a distinct purpose. Let’s explore them in detail.
Home Sheet
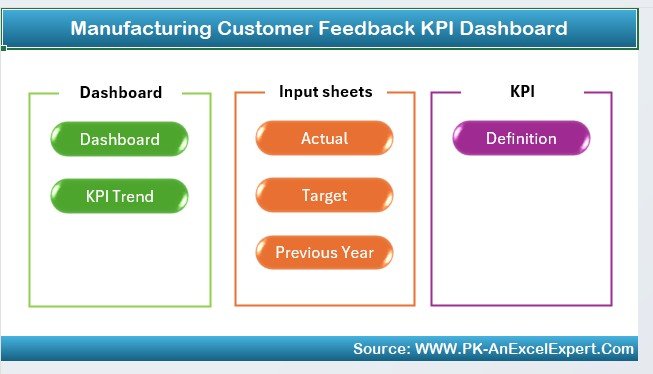
The Home sheet acts as a user-friendly index page. It features six navigation buttons that allow users to quickly jump to different sections of the dashboard, improving accessibility and usability.
Dashboard Sheet Tab
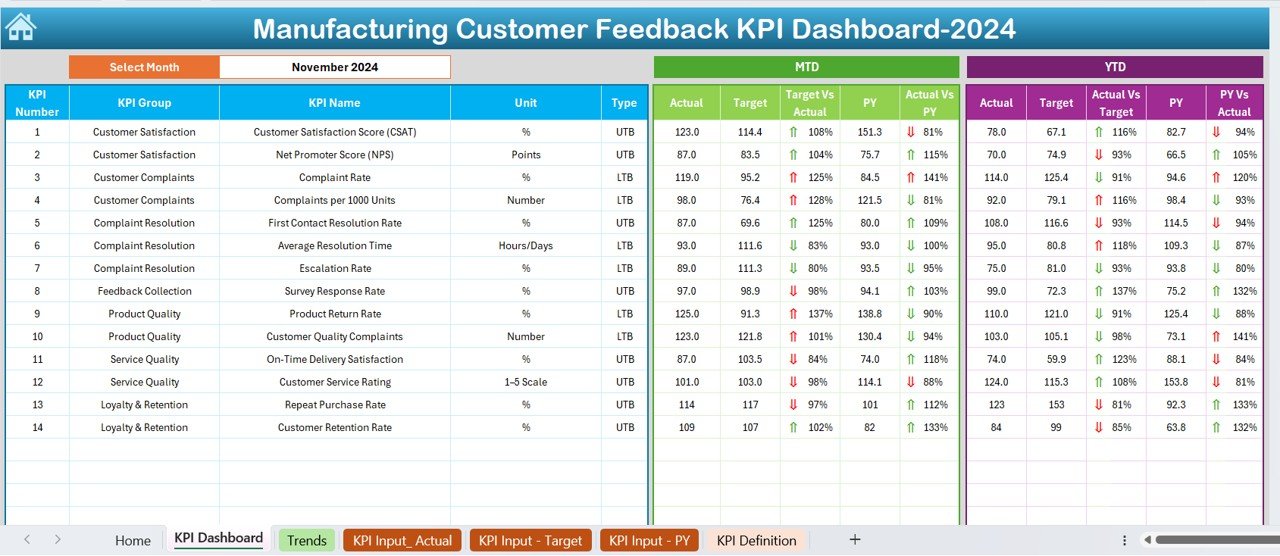
This is the heart of the dashboard. All essential metrics and KPIs related to customer feedback are displayed here.
You can select the month using the drop-down in cell D3.
- KPIs update automatically based on the month selected.
- Metrics shown include:
- MTD (Month-to-Date) Actual, Target, Previous Year
- YTD (Year-to-Date) Actual, Target, Previous Year
- Visual cues using conditional formatting (up/down arrows) highlight performance trends.
This tab helps leadership make quick, data-driven decisions without digging through multiple sheets.
KPI Trend Sheet Tab
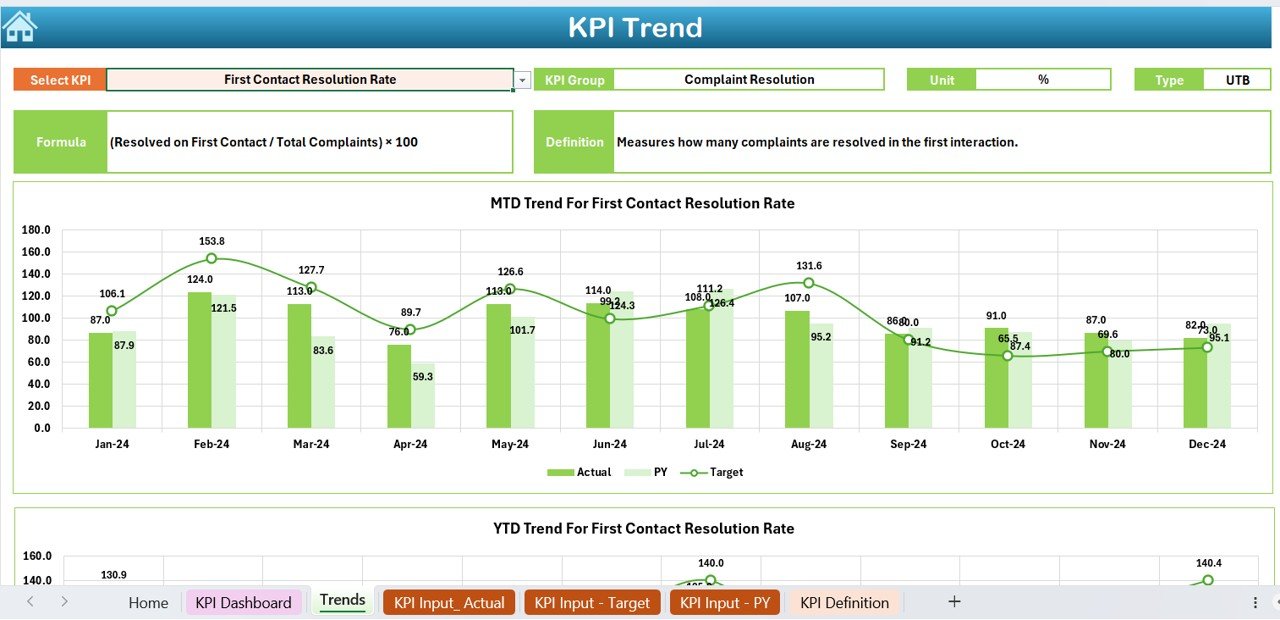
This tab provides a more granular look at KPI performance trends over time.
- Select the KPI name from cell C3
- View associated information such as:
- KPI Group
- Unit
- Type (Lower the Better / Upper the Better)
- Formula
- Definition
- Track MTD and YTD progress with trend charts comparing Actual, Target, and Previous Year
It helps identify long-term patterns that may require corrective actions.
Actual Numbers Input Sheet
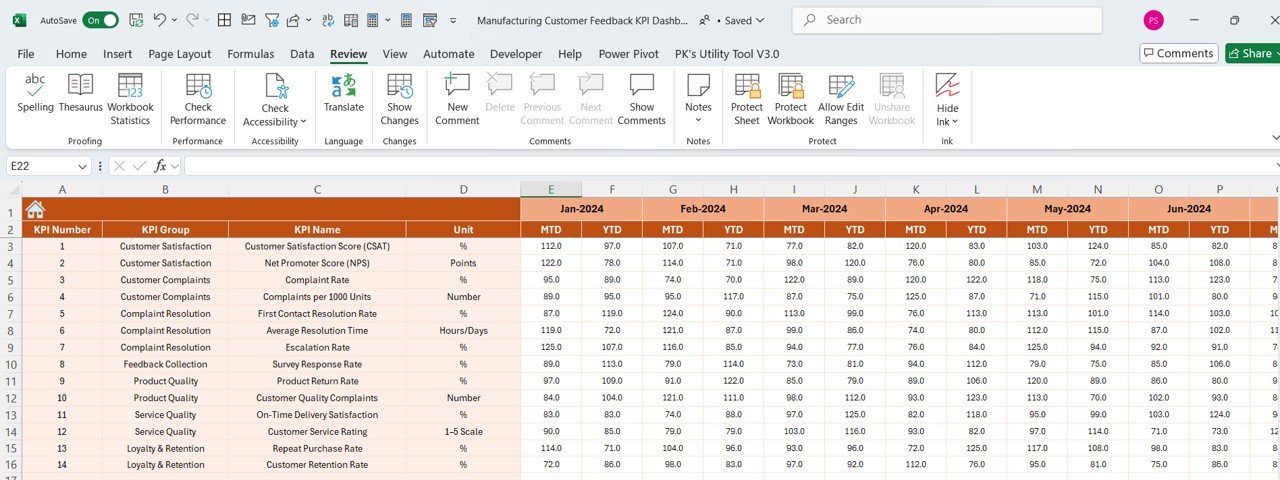
Data input starts here. Users enter actual performance numbers for:
- MTD (Month-to-Date)
- YTD (Year-to-Date)
All you need to do is enter the starting month of the year in cell E1. The rest of the layout adjusts automatically, making it very intuitive.
Target Sheet Tab
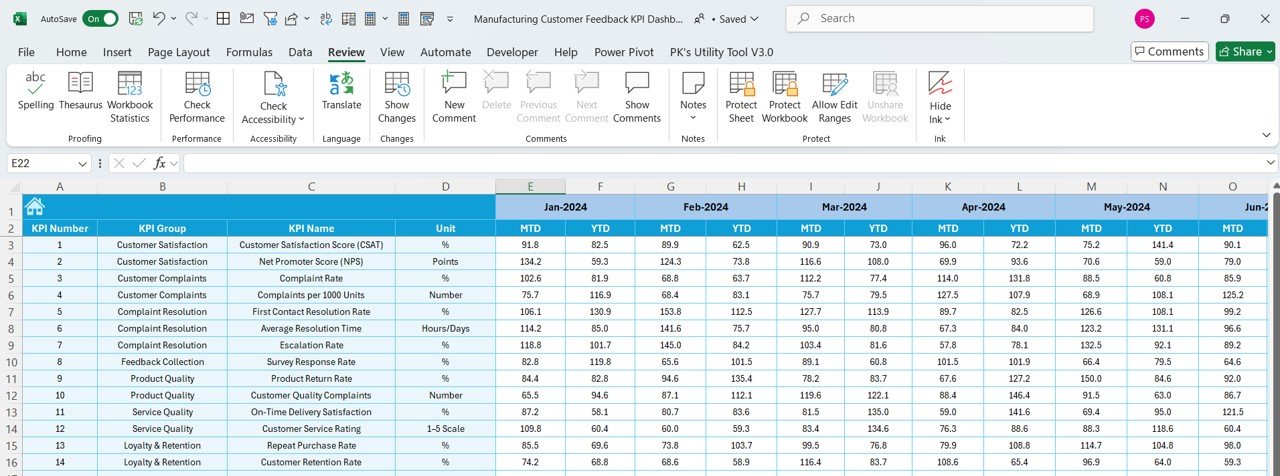
- Set your performance goals in this tab.
- Enter both MTD and YTD target values for each KPI
- Aligns your dashboard with strategic manufacturing objectives
Click to Purchase Manufacturing Customer Feedback KPI Dashboard in Excel
Previous Year Numbers Sheet Tab
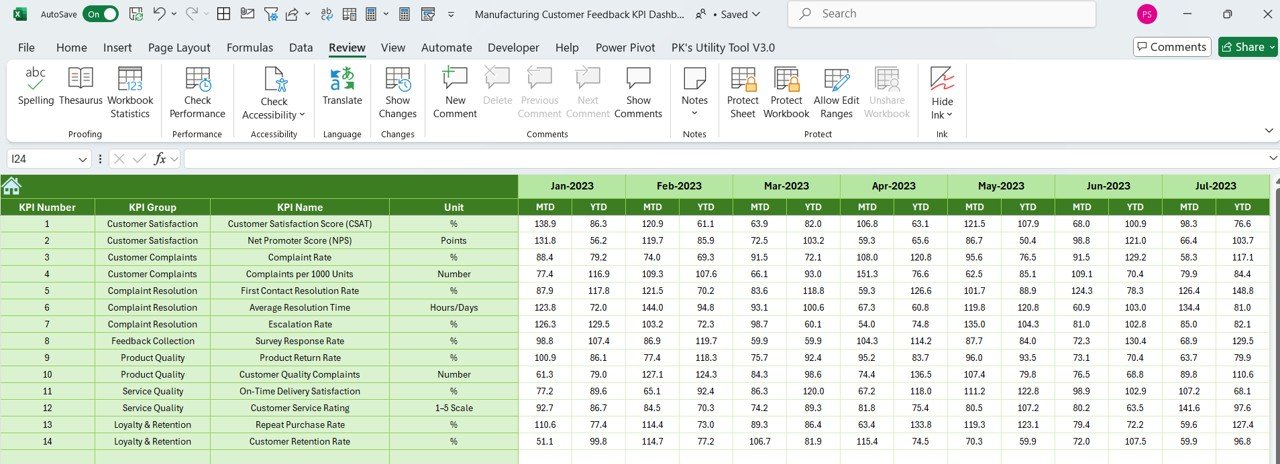
- To analyze performance improvement or decline, enter:
- MTD values
- YTD values
…for the same month of the previous year. This comparison helps contextualize current performance.
KPI Definition Sheet Tab
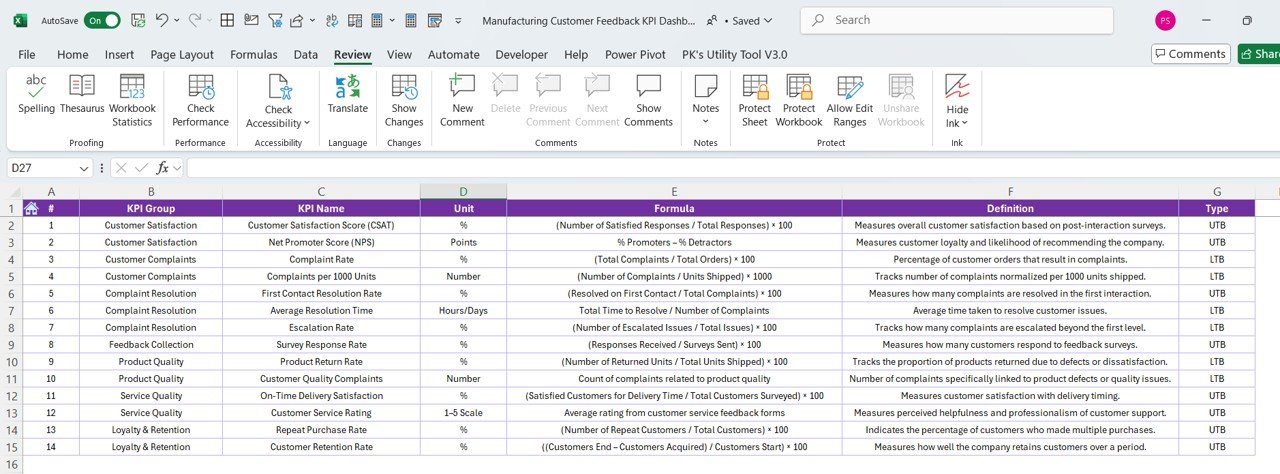
This acts as the reference guide for your dashboard.
- List all KPI Names
- Define their Unit, Formula, and Meaning
- Specify which KPI Group it belongs to
Having these definitions in one place ensures that everyone across departments interprets the KPIs consistently.
Advantages of Using This Dashboard
Implementing this dashboard in your manufacturing unit offers several tangible benefits:
🔄 Real-Time Performance Tracking: Quickly monitor how well your team is meeting customer expectations.
📈 Improved Decision-Making: Visual trends and comparison charts enable proactive management.
✅ Standardized Data Entry: With predefined fields, it ensures data accuracy and consistency.
🌟 Customization-Friendly: Add or remove KPIs based on your unique business goals.
🔗 Team Collaboration: Centralized format allows managers, supervisors, and analysts to work together seamlessly.
Best Practices for Using a Feedback KPI Dashboard in Excel
To get the most out of your dashboard, consider the following tips:
- Keep It Updated Regularly: Data becomes meaningless if it’s outdated. Designate someone to enter actual and target values at the start of each month.
- Review KPIs Quarterly: Not all KPIs will remain relevant. Reevaluate them quarterly to ensure they still align with business goals.
- Use Conditional Formatting Wisely: While visual cues are helpful, overuse can clutter your dashboard. Use formatting only where it adds value.
- Train Your Team: Ensure everyone involved knows how to enter data and interpret charts correctly. A short training session can go a long way.
- Backup the File: Always keep a backup, especially before entering new data. Excel files can become corrupted, and data loss can derail tracking efforts.
Conclusion
The Manufacturing Customer Feedback KPI Dashboard in Excel is more than a spreadsheet. It’s a strategic asset for companies that want to harness the power of customer feedback. With its interactive design, flexible data entry, and insightful visualizations, this dashboard makes feedback management efficient and impactful.
Start using it today to unlock new levels of operational excellence and customer satisfaction.
Frequently Asked Questions (FAQs)
Q1. Can I add more KPIs to the dashboard?
Yes, the dashboard is fully customizable. You can add new KPIs in the definition sheet and extend corresponding entries in all other sheets.
Q2. Is it suitable for small manufacturing units?
Absolutely. Whether you’re a small plant or a large enterprise, this Excel-based solution scales to your needs.
Q3. Do I need advanced Excel skills to use this dashboard?
Not at all. Basic Excel knowledge is sufficient. The dashboard uses drop-downs and clearly marked fields to guide users.
Q4. Can I use it for non-manufacturing industries?
While it’s designed for manufacturing, the template can be adapted to any industry where customer feedback is critical.
Q5. Is there a mobile version available?
The dashboard works best on desktop Excel, but it can be viewed on mobile through Excel apps with limited editing.
Click to Purchase Manufacturing Customer Feedback KPI Dashboard in Excel
Visit our YouTube channel to learn step-by-step video tutorials
Watch the step-by-step video Demo: