In today’s competitive business landscape, the growth of a sales and marketing team depends heavily on continuous learning and development. However, tracking progress, evaluating performance, and identifying areas of improvement can be challenging without a structured system. That’s where a Sales and Marketing Training and Development KPI Dashboard in Excel comes in handy.
This comprehensive, ready-to-use Excel template allows managers and business leaders to track Key Performance Indicators (KPIs) linked to training, onboarding, skills development, knowledge retention, and overall team performance.
Let’s dive deep into what this dashboard offers, why it matters, how to use it, and the best practices for maximizing its potential.
Click to Purchases Sales and Marketing Training and Development KPI Dashboard in Excel
What is a Sales and Marketing Training and Development KPI Dashboard?
A Sales and Marketing Training and Development KPI Dashboard is an interactive Excel-based tool that tracks and visualizes KPIs related to the learning and development of sales and marketing professionals. These KPIs typically include training hours, completion rates, sales enablement metrics, product knowledge scores, and more.
Rather than relying on scattered spreadsheets or manual reports, this dashboard centralizes all essential data in one place, enabling decision-makers to:
- Monitor MTD (Month-to-Date) and YTD (Year-to-Date) performance.
- Compare results against targets and previous year data.
- Visualize trends over time.
- Adjust training strategies as needed.
Key Features of the Excel Dashboard
This KPI dashboard comes with 7 well-organized worksheet tabs, each serving a unique purpose:
Home Sheet
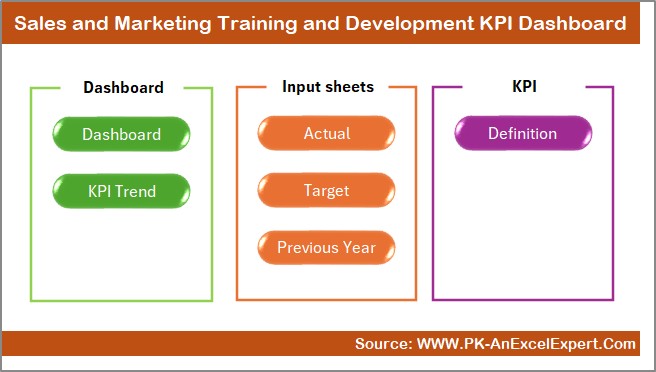
- Acts as the landing page.
- Contains clickable buttons for easy navigation to all other sheets.
Dashboard Sheet
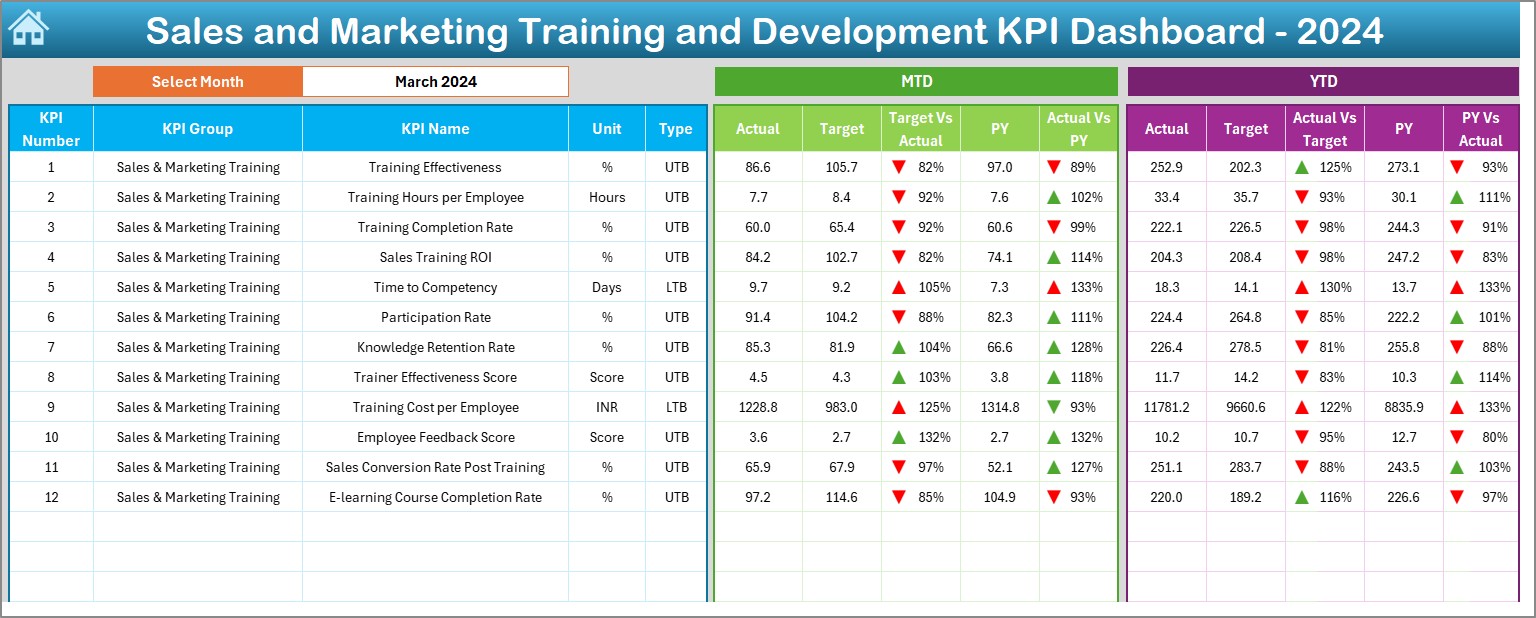
- The central hub displaying KPI metrics.
- Allows you to select a month from a dropdown (Cell D3).
- Auto-updates MTD and YTD values for:
- Actual numbers
- Targets
- Previous year’s data
- Includes Target vs Actual and PY vs Actual comparisons with conditional up/down arrows.
KPI Trend Sheet
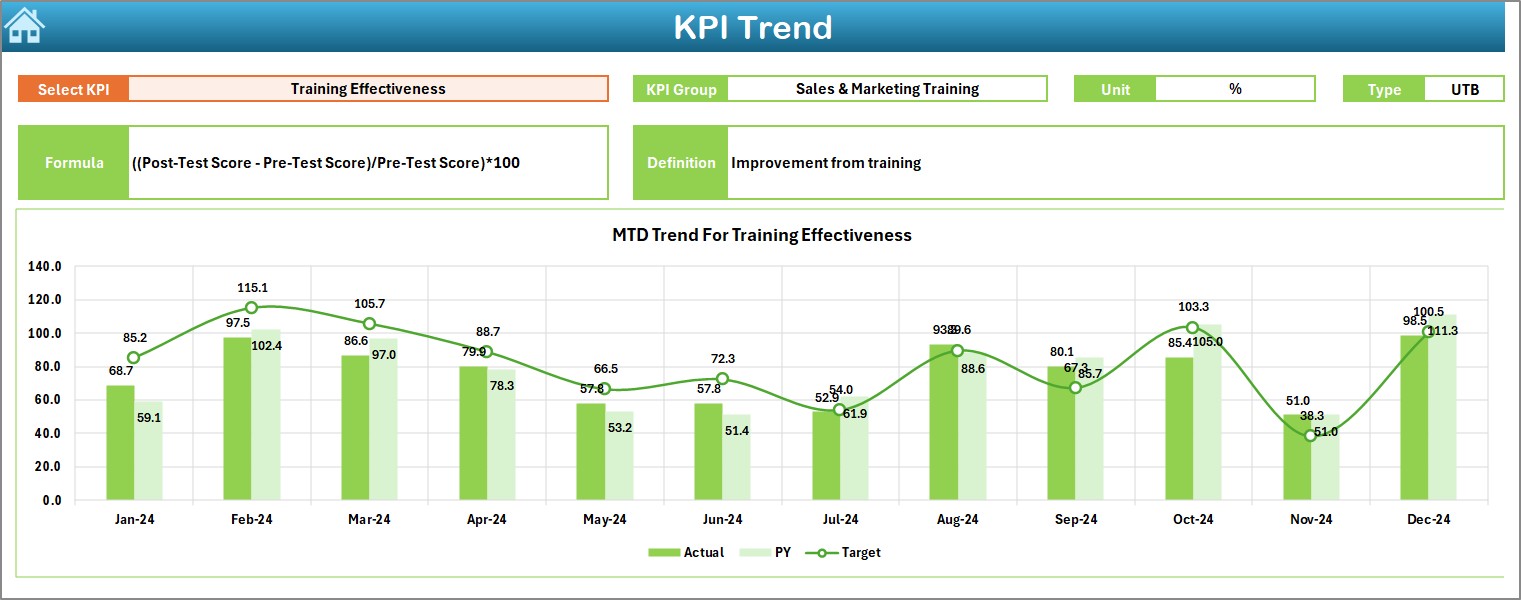
Select KPI from a dropdown (Cell C3).
View:
- KPI Group
- KPI Unit
- Type (UTB or LTB)
- KPI Formula
- Definition
See charts visualizing MTD and YTD trends across months.
Actual Numbers Input Sheet
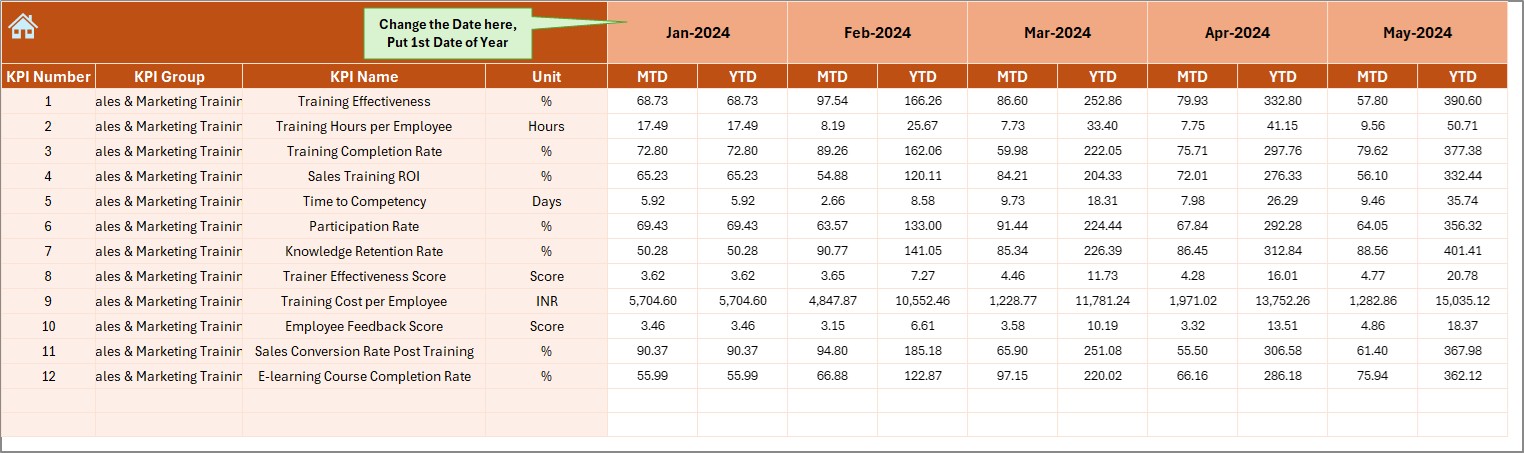
- Manually enter MTD and YTD actuals per month.
- Select the first month of the year using cell E1.
Target Sheet
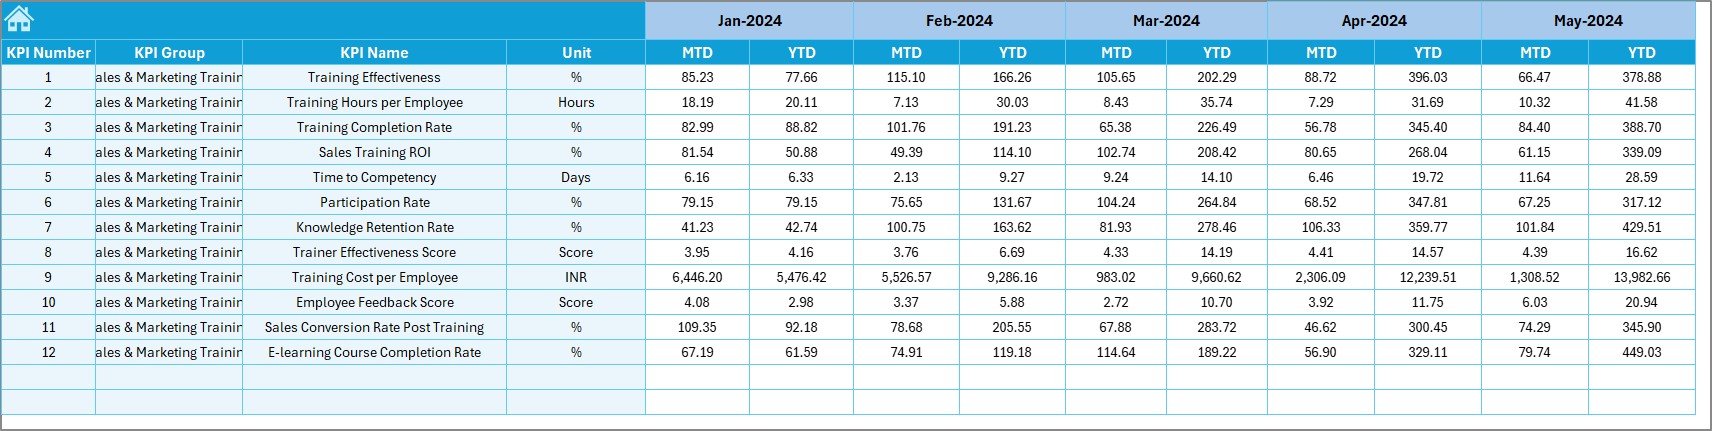
- Input monthly KPI targets (both MTD and YTD).
Previous Year Number Sheet
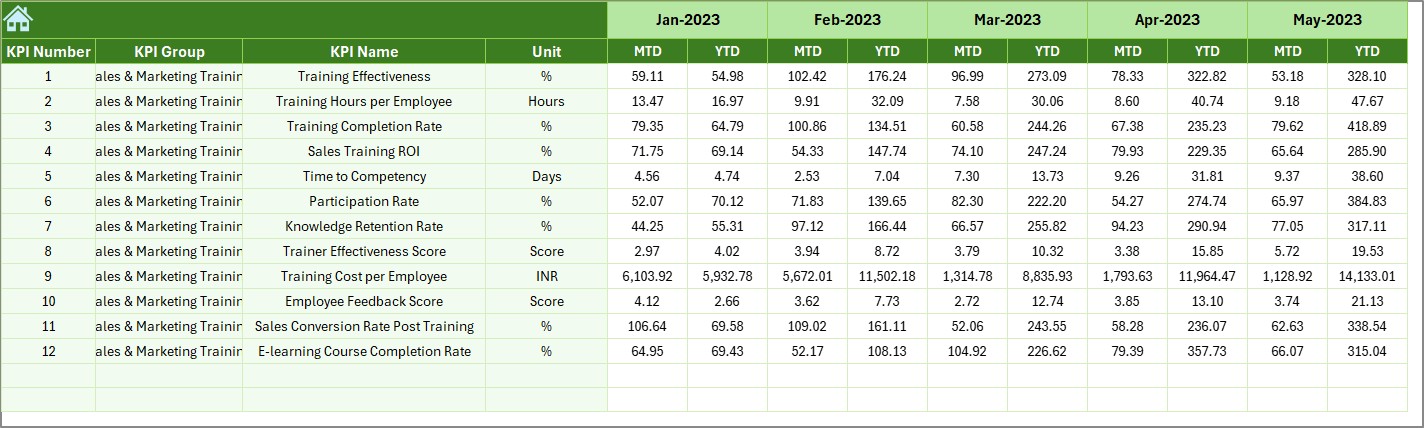
- Record last year’s KPI values to compare with the current year.
KPI Definition Sheet
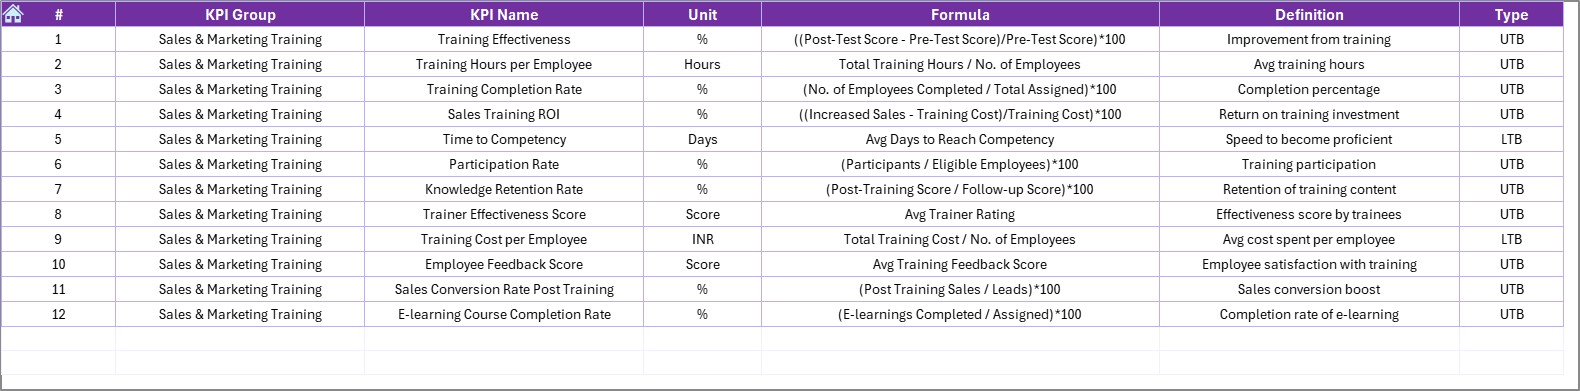
Define each KPI clearly.
Include:
- KPI Name
- KPI Group
- Unit
- Formula
- Brief, clear definition
Why You Need This Dashboard for Your Team
When training and development become measurable, improvements follow. Here’s how this dashboard can benefit your organization:
✅ Real-time Visibility: You can track performance as it unfolds, identify who is lagging, and offer targeted support.
✅ Better Decision-Making: KPI trends help in evaluating which training modules are working and which need to be revised or replaced.
✅ Data-Driven Culture: Encourages accountability by linking training outcomes with performance.
✅ Strategic Growth: Improves onboarding, shortens the ramp-up time, and supports long-term skills enhancement.
Best Practices for Using the Training & Development KPI Dashboard
Click to Purchases Sales and Marketing Training and Development KPI Dashboard in Excel
To ensure that this dashboard delivers maximum value, follow these best practices:
- Keep the KPI List Relevant: Choose KPIs that directly impact your team’s learning objectives and business goals.
- Update Data Regularly: Enter actuals, targets, and PY numbers monthly to keep the dashboard up to date.
- Use Conditional Formatting for Impact: Visual indicators like arrows and colors instantly show whether performance is improving or declining.
- Train Users on How to Use It: Make sure team leaders or HR professionals understand how to navigate and interpret the dashboard.
- Review Trends Frequently: Don’t just look at MTD values. Analyze YTD and historical trends to spot training gaps early.
Advantages of the Sales and Marketing Training and Development KPI Dashboard
📈 Enhances Performance Monitoring: Gives you a clear view of how well training initiatives are working.
👥 Supports Individual Growth: Identifies team members who may need personalized coaching.
⌚ Saves Time: Automates KPI calculations, reducing manual work and errors.
📘 Offers Documentation: Acts as a record of training effectiveness that can be presented to upper management.
🌐 Scalable and Shareable: Can be customized and shared easily with different departments or stakeholders.
KPIs to Include in Your Dashboard
Here are some common KPIs you can track using this Excel dashboard:
- Training Hours Completed – Number of hours each team member has spent in training.
- Training Completion Rate – Percentage of employees who completed a training module.
- Average Test Scores – Post-training assessment scores.
- Sales Enablement Score – How well training translates to better sales readiness.
- Time to Productivity – Days from onboarding to full performance.
- Course Feedback Score – Average rating by participants.
- Knowledge Retention Rate – Score from periodic knowledge checks.
- Certification Rate – Number of employees certified post-training.
How to Set It Up Step-by-Step
- Start with the KPI Definition Sheet
- List down all KPIs, their units, formulas, and definitions.
- Move to the Target Sheet
- Enter MTD and YTD targets for each KPI.
- Fill in Previous Year Numbers
- Input last year’s actual performance.
- Monthly Data Entry
- On the Actual Numbers Input sheet, update actual MTD and YTD numbers each month.
- Dashboard Review
- Go to the Dashboard sheet and select a month in D3.
- Review performance metrics, trends, and visual indicators.
- Trend Analysis
- Use the KPI Trend Sheet to analyze performance over months.
Who Can Use This Dashboard?
- This dashboard is ideal for:
- Sales Managers
- Training Coordinators
- HR Professionals
- Learning & Development Teams
- Marketing Team Leads
- Business Analysts
Customization Tips
- Add new KPIs as your training programs evolve.
- Modify the charts to include benchmarks or industry standards.
- Integrate Power Query or VBA for automation.
- Convert it to Google Sheets for real-time collaboration.
Conclusion
A Sales and Marketing Training and Development KPI Dashboard in Excel is more than just a spreadsheet. It’s a powerful management tool that empowers organizations to track, measure, and enhance their learning initiatives. By keeping everything structured, easy to update, and visual, this dashboard turns raw data into actionable insights.
Whether you’re trying to onboard new team members faster or ensure your current staff is always learning, this Excel-based system is your go-to resource for measurable growth.
Frequently Asked Questions (FAQs)
❓ What is the purpose of a training and development KPI dashboard?
It helps businesses track training efforts, measure effectiveness, and align learning with performance goals.
❓ Can I customize this Excel dashboard for my organization?
Yes! You can add or remove KPIs, change formulas, and update the layout as per your needs.
❓ How often should I update the dashboard?
Ideally, update it monthly to maintain accuracy and track trends effectively.
❓ Is it suitable for small businesses?
Absolutely. Small businesses can use it to track team performance without investing in expensive software.
Click to Purchases Sales and Marketing Training and Development KPI Dashboard in Excel
Visit our YouTube channel to learn step-by-step video tutorials