In the competitive world of eCommerce, abandoned carts pose one of the most significant challenges to online retailers. A large percentage of potential sales are lost when customers add items to their shopping carts but fail to complete the purchase. To mitigate this, businesses need a system to track and recover abandoned carts effectively. This is where an Abandoned Cart Recovery KPI Dashboard in Excel comes in.
In this article, we will explore how an Abandoned Cart Recovery KPI Dashboard can help you track key metrics, recover lost sales, and optimize your overall eCommerce performance. We will also cover how to use this Excel-based dashboard, its features, and the essential KPIs to monitor for better conversion rates.
What is an Abandoned Cart Recovery KPI Dashboard?
An Abandoned Cart Recovery KPI Dashboard is a tool that helps businesses track the percentage of shopping carts abandoned by users, identify the reasons for cart abandonment, and monitor efforts to recover lost sales. The dashboard highlights key performance indicators (KPIs) related to abandoned carts and provides insights into which strategies are working to bring customers back to complete their purchases.
By utilizing this dashboard, businesses can:
-
Understand the extent of abandoned carts.
-
Track recovery strategies such as email campaigns, retargeting ads, and promotions.
-
Identify areas for improvement in the checkout process.
-
Measure the effectiveness of interventions in improving conversion rates.
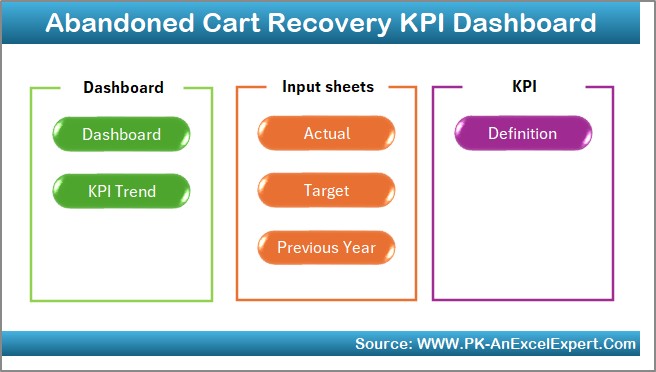
Key Features of the Abandoned Cart Recovery KPI Dashboard in Excel
An effective Abandoned Cart Recovery KPI Dashboard has several key features that allow businesses to track, analyze, and improve their abandoned cart recovery efforts. Below are the main components included in this Excel template:
1. Home Sheet Tab
The Home Sheet Tab serves as the starting point for your dashboard. It provides an easy way to navigate between the different sections of the dashboard. You can click on links to quickly jump to the relevant worksheets, making it user-friendly and efficient for regular use.
Click to buy Abandoned Cart Recovery KPI Dashboard in Excel
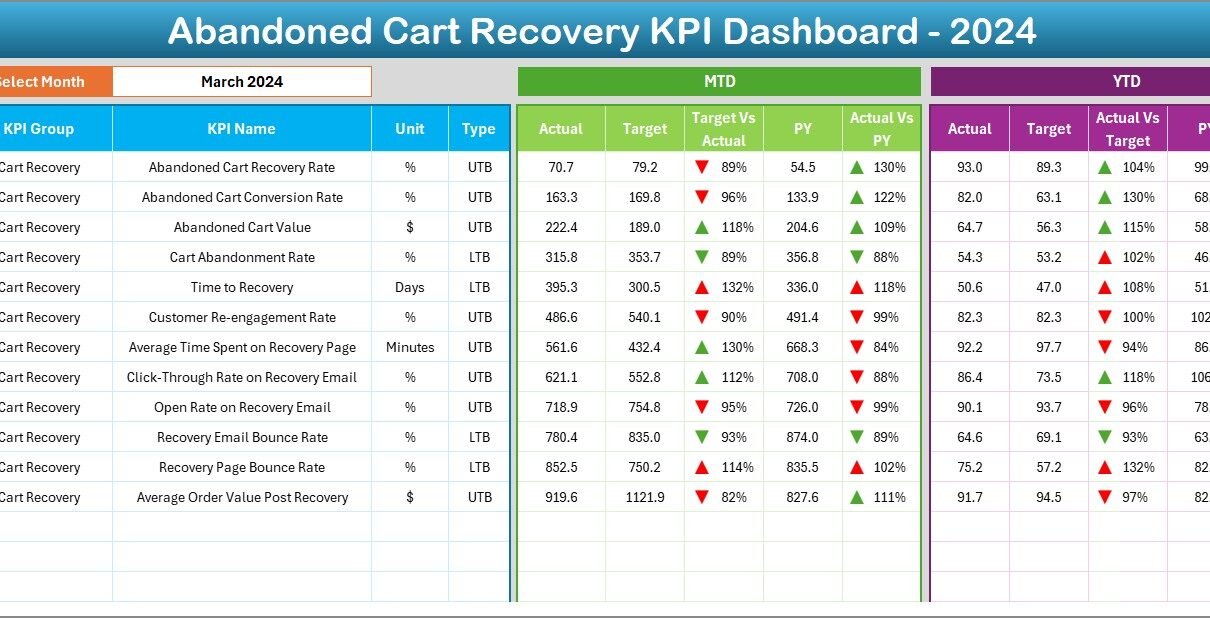
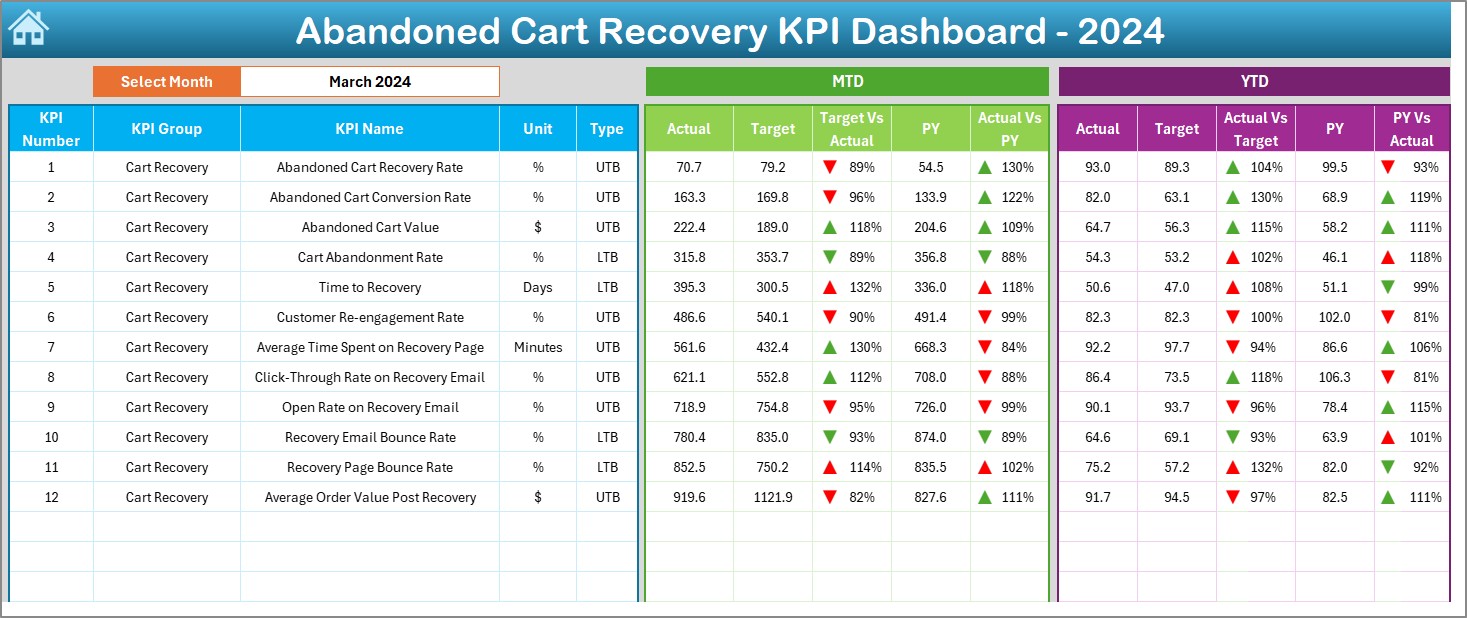
2. Dashboard Sheet Tab
The Dashboard Sheet Tab is the central hub of your KPI tracking. It displays all the essential data about the abandoned cart recovery process. Key features of this sheet include:
-
MTD (Month-to-Date) Actuals: Displays the actual performance for the selected month.
-
Targets: Displays the predefined recovery targets set for the month.
-
Previous Year Comparison: Compares current year data with the previous year’s data.
-
Target vs. Actual and PY vs. Actual: Use conditional formatting (up/down arrows) to visually show whether the metrics are above or below expectations.
The month selector (D3) allows you to choose the month you wish to analyze, and the data will automatically update to reflect that month’s performance.
Click to buy Abandoned Cart Recovery KPI Dashboard in Excel
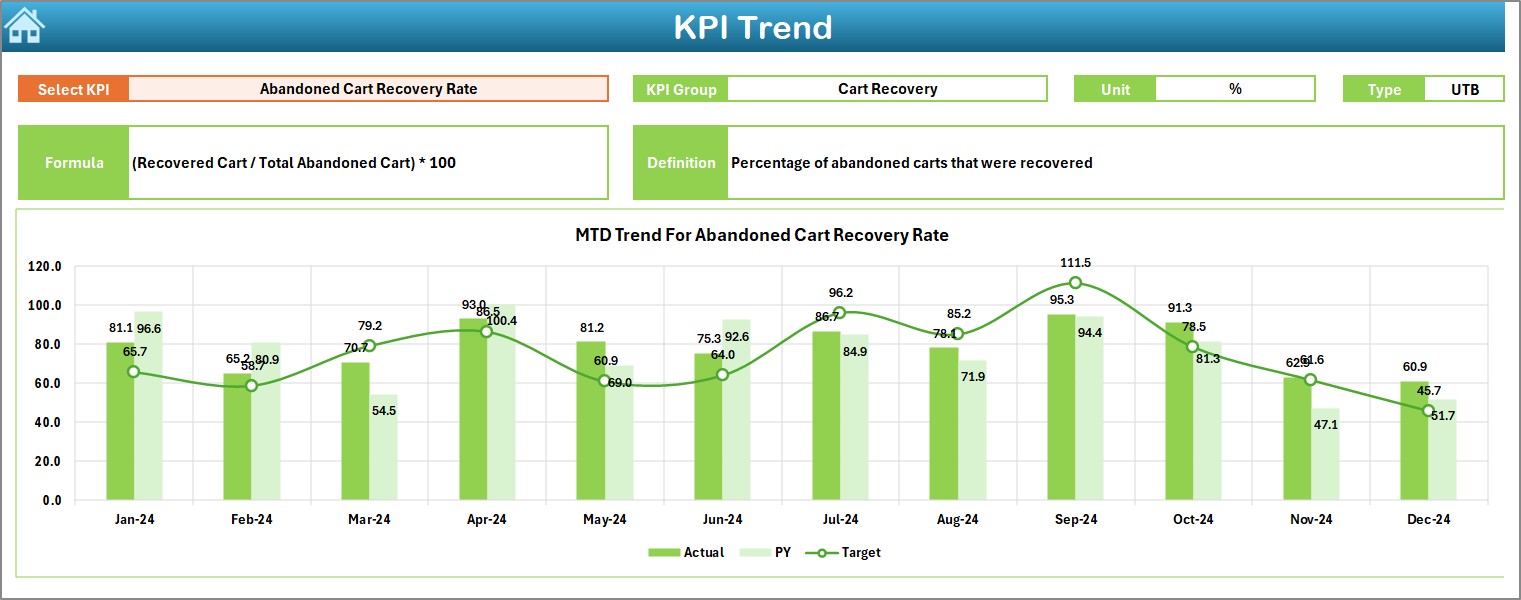
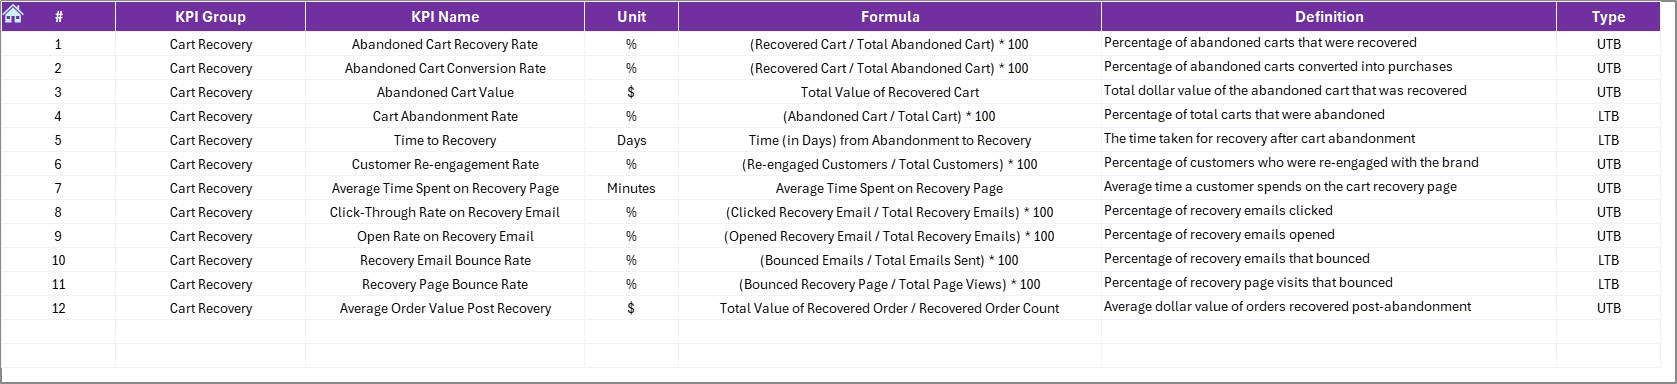
3. KPI Trend Sheet Tab
In the KPI Trend Sheet Tab, you can track and analyze the trends of various KPIs over time. Features of this sheet include:
-
KPI Group: Grouping of related KPIs (e.g., Abandoned Cart Rate, Cart Recovery Rate).
-
KPI Unit: Measurement units for each KPI (e.g., Percentage, Count).
-
KPI Type: Indicates whether the KPI is “Lower the Better” (LTB) or “Upper the Better” (UTB).
-
Formula and Definition: The sheet provides the formulas used to calculate each KPI, along with a brief definition.
4. Actual Numbers Sheet Tab
The Actual Numbers Sheet Tab allows you to input the actual data for each KPI. You can enter values for MTD (Month-to-Date) and YTD (Year-to-Date) performance. Simply input the first month of the year in cell E1, and the rest of the dashboard will adjust accordingly
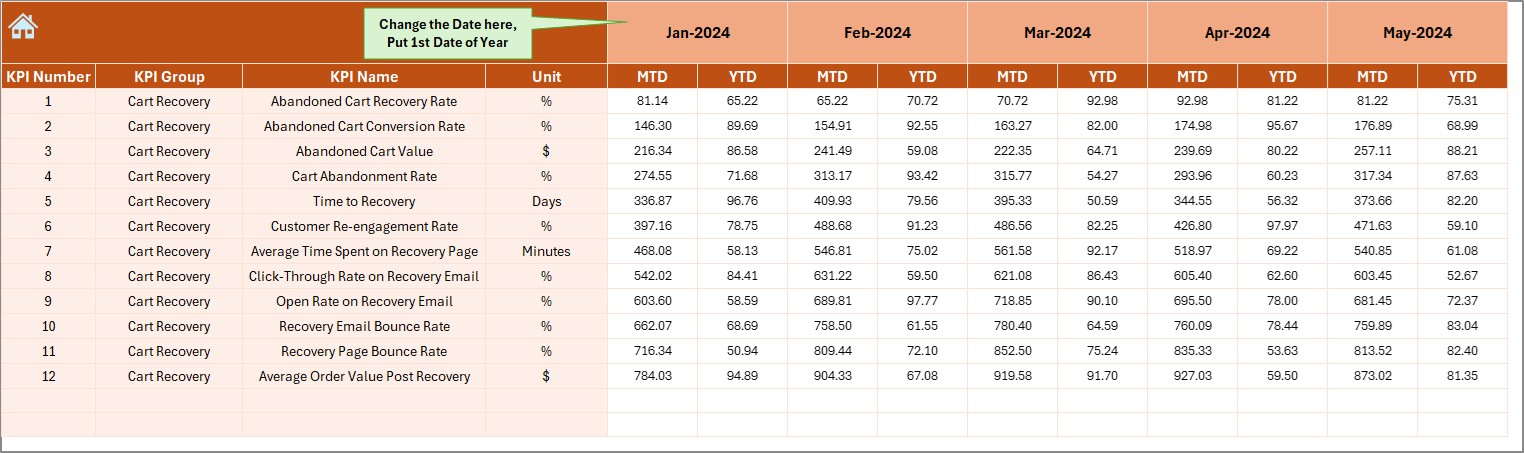
.Click to buy Abandoned Cart Recovery KPI Dashboard in Excel
5. Target Sheet Tab
In the Target Sheet Tab, you can input the target values for each KPI. Targets are critical for tracking your performance against set goals. Enter your target numbers for each KPI, both MTD and YTD, to compare with actual results.

6. Previous Year Numbers Sheet Tab
This tab stores the previous year’s data, enabling you to compare current performance with the historical data. By tracking previous year data, you can gauge growth and identify areas for improvement.

Click to buy Abandoned Cart Recovery KPI Dashboard in Excel
7. KPI Definition Sheet Tab
The KPI Definition Sheet Tab serves as a reference guide for all KPIs included in the dashboard. It includes detailed information about each KPI, including:
-
KPI Name
-
KPI Group
-
Unit of Measurement
-
Formula
-
Definition
This sheet helps you understand the metrics and their significance for abandoned cart recovery.
Advantages of Using the Abandoned Cart Recovery KPI Dashboard
Implementing an Abandoned Cart Recovery KPI Dashboard in Excel offers several advantages for eCommerce businesses:
-
Real-Time Monitoring: You can track abandoned carts and recovery efforts in real time, allowing for quick adjustments to your strategies.
-
Data-Driven Insights: The dashboard provides data-driven insights that help you make informed decisions on improving the checkout process and recovery strategies.
-
Improved Customer Retention: By tracking recovery rates, you can improve customer retention through targeted interventions such as abandoned cart emails or retargeting ads.
-
Actionable Metrics: With clear metrics like the Cart Recovery Rate and Conversion Rate from Recovery Efforts, you can evaluate which recovery strategies are most effective.
Opportunities for Improvement in Abandoned Cart Recovery
While the dashboard offers valuable insights, there are always areas for improvement:
-
Improve the Checkout Process: Simplifying the checkout process can reduce abandonment rates. Reduce the number of steps, offer guest checkout options, and optimize for mobile users.
-
Optimize Recovery Emails: Personalizing recovery emails and adding incentives such as discounts can improve the chances of recovering abandoned carts.
-
Target the Right Audience: Use data analytics to target users who are more likely to convert after abandoning their cart, improving the efficiency of your recovery efforts.
-
Test Recovery Strategies: Conduct A/B tests on different recovery strategies to determine which one works best for your audience.
Best Practices for Abandoned Cart Recovery
Here are some best practices to maximize the effectiveness of your Abandoned Cart Recovery KPI Dashboard:
-
Automate Recovery Emails: Set up automated email campaigns to remind customers of abandoned carts, offer discounts, or promote urgency.
-
Provide Multiple Payment Options: Ensure that your website offers multiple payment options to reduce friction during checkout.
-
Use Exit-Intent Popups: Display pop-ups offering discounts or free shipping to users who are about to leave your site without completing their purchase.
-
Monitor KPIs Regularly: Consistently track and analyze your Cart Recovery Rate and Conversion Rate from Recovery Efforts to identify areas for improvement.
-
Test and Refine: Continuously test different strategies and refine your approach to abandoned cart recovery based on the data collected.
Frequently Asked Questions (FAQs)
Click to buy Abandoned Cart Recovery KPI Dashboard in Excel
1. What is the Abandoned Cart Recovery KPI Dashboard?
The Abandoned Cart Recovery KPI Dashboard is an Excel-based tool that helps eCommerce businesses track and recover abandoned carts. It tracks key metrics like Abandoned Cart Rate, Cart Recovery Rate, and Conversion Rate from Recovery Efforts.
2. How do I calculate the Cart Recovery Rate?
The formula for Cart Recovery Rate is:
Cart Recovery Rate=(Recovered CartsAbandoned Carts)×100\text{Cart Recovery Rate} = \left( \frac{\text{Recovered Carts}}{\text{Abandoned Carts}} \right) \times 100Cart Recovery Rate=(Abandoned CartsRecovered Carts)×100
This KPI helps you measure the effectiveness of your abandoned cart recovery strategies.
3. How can the Abandoned Cart Recovery Dashboard improve my business?
By tracking and analyzing abandoned cart metrics, businesses can identify where recovery efforts are working and where improvements are needed, ultimately increasing conversion rates and revenue.
4. What strategies can I use to reduce cart abandonment?
Improving the checkout process, offering incentives like discounts, and using exit-intent popups are effective strategies for reducing cart abandonment.
5. How often should I update the data in the KPI dashboard?
You should update the data regularly (daily, weekly, or monthly) to monitor trends and assess the effectiveness of your cart recovery strategies.
Conclusion
The Abandoned Cart Recovery KPI Dashboard in Excel is an invaluable tool for eCommerce businesses. By tracking key metrics and recovery efforts, businesses can improve conversion rates, reduce abandoned carts, and increase revenue. Whether you’re just starting with abandoned cart recovery or looking to optimize existing efforts, this dashboard provides the insights and tools you need to succeed.
Visit our YouTube channel to learn step-by-step video tutorials
Watch the step-by-step video Demo: