In today’s rapidly evolving digital landscape, cybersecurity is more important than ever. As cyber threats become increasingly sophisticated, organizations need real-time visibility into their security posture. One of the most effective ways to achieve this is by utilizing a Cyber Incident Response KPI Dashboard in Power BI. This powerful tool provides comprehensive insights into key performance indicators (KPIs), helping organizations monitor, evaluate, and improve their cyber incident response.
In this article, we will delve into the features, advantages, opportunities for improvement, and best practices of using a Cyber Incident Response KPI Dashboard in Power BI. We will also discuss how this dashboard helps organizations respond to cyber threats effectively, ensuring that key metrics are closely tracked and analyzed.
What is the Cyber Incident Response KPI Dashboard in Power BI?
The Cyber Incident Response KPI Dashboard in Power BI is an advanced analytics tool designed to track and visualize key cybersecurity metrics. This dashboard allows organizations to monitor the status of their cybersecurity performance in real-time by focusing on the most important KPIs related to cyber incident response. The dashboard is built in Power BI, a powerful business analytics service by Microsoft, which provides interactive data visualization and business intelligence capabilities.
The Cyber Incident Response KPI Dashboard uses data from Excel files to generate real-time insights. It offers detailed information about KPIs, including current and past performance, targets, and comparisons with previous years. The dashboard is divided into three primary pages, each serving a unique purpose to help monitor and assess the overall cyber incident response efforts.
Key Features of the Cyber Incident Response KPI Dashboard in Power BI
Click to buy Cyber Incident Response KPI Dashboard in Power BI
The Cyber Incident Response KPI Dashboard in Power BI includes three main pages that provide different levels of insight into the incident response process. Let’s explore the key features of these pages:
1. Summary Page
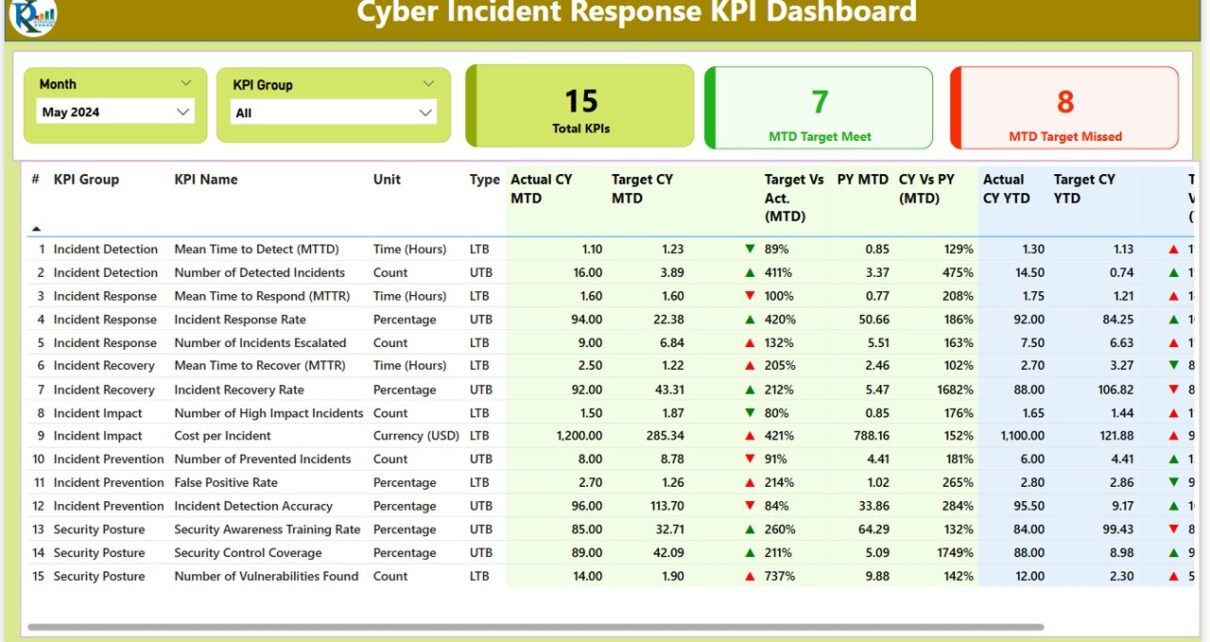
The Summary Page is the heart of the dashboard, offering a high-level view of the organization’s cybersecurity performance. This page includes the following key components:
Slicers: The slicers at the top of the page allow users to filter data by month and KPI group. This makes it easy to zoom in on specific time periods and KPI categories.
KPI Overview Cards: The dashboard displays three cards showing key figures:
- Total KPIs Count: The total number of KPIs being tracked.
- MTD Target Met: The number of KPIs that have met the month-to-date (MTD) target.
- MTD Target Missed: The number of KPIs that have missed the MTD target.
KPI Table: Below the KPI overview cards, the detailed KPI table shows the following information:
- KPI Number: A unique sequence number for each KPI.
- KPI Group: The group or category to which the KPI belongs.
- KPI Name: The name of the KPI.
- Unit: The unit of measurement for the KPI.
- Type (LTB or UTB): Indicates whether the KPI follows a “Lower the Better” (LTB) or “Upper the Better” (UTB) approach.
- Actual CY MTD: The actual value for the current year’s month-to-date (MTD) performance.
- Target CY MTD: The target value for the current year’s MTD performance.
- MTD Icon: Red (▼) or green (▲) icons indicate whether the KPI has met or missed the MTD target.
- Target vs Actual (MTD): The percentage comparison between the actual MTD value and the target MTD value.
- PY MTD: The same MTD value from the previous year for comparison.
- CY vs PY (MTD): The percentage comparison between the current year’s MTD and the previous year’s MTD.
YTD Metrics: In addition to MTD metrics, the summary page includes year-to-date (YTD) data:
- Actual CY YTD: The actual value for the current year’s YTD performance.
- Target CY YTD: The target value for the current year’s YTD performance.
- YTD Icon: Red (▼) or green (▲) icons indicate whether the KPI has met or missed the YTD target.
- Target vs Actual (YTD): The percentage comparison between the actual YTD value and the target YTD value.
- PY YTD: The YTD value from the previous year for comparison.
- CY vs PY (YTD): The percentage comparison between the current year’s YTD and the previous year’s YTD.
2. KPI Trend Page
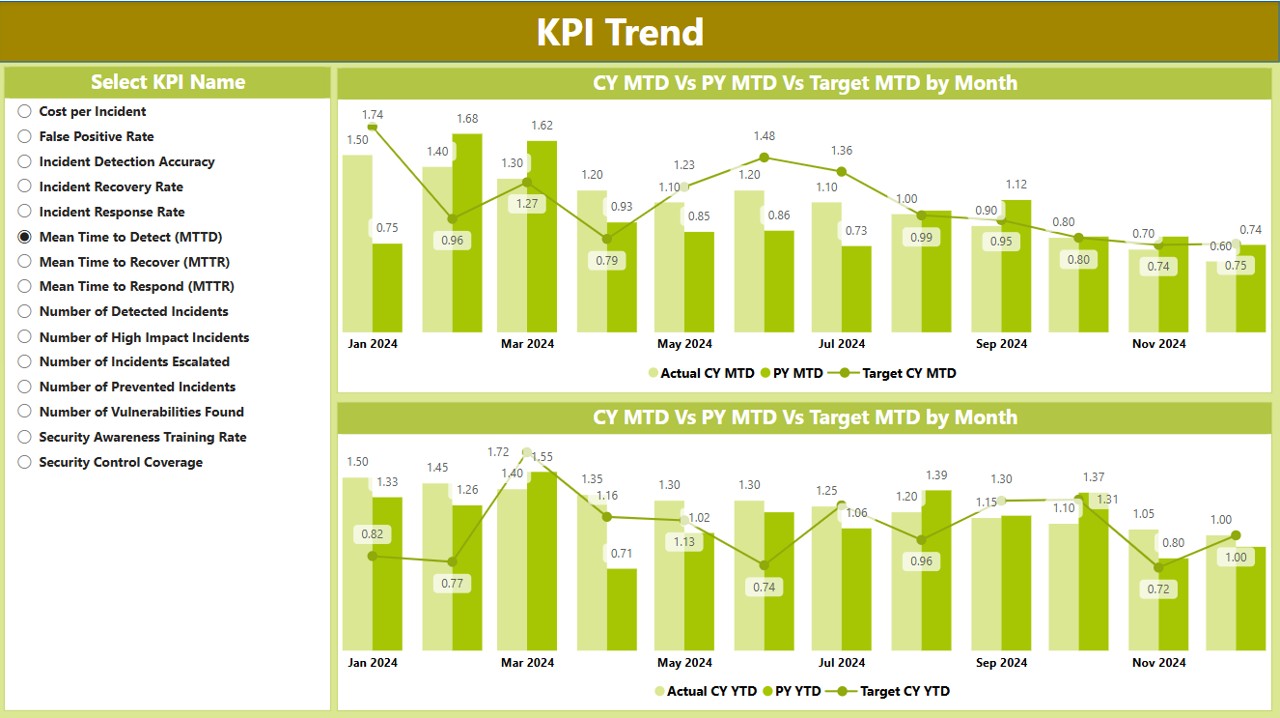
The KPI Trend Page is designed to provide a detailed view of trends in cybersecurity performance over time. It includes:
-
Combo Charts: The page features two combo charts to visualize the trends of actual numbers for both the current year and previous year, as well as targets for MTD and YTD.
-
Slicer for KPI Name: A slicer allows users to select a specific KPI and see its trend over time, providing insights into how the KPI has evolved and whether improvements or adjustments are needed.
Click to buy Cyber Incident Response KPI Dashboard in Power BI
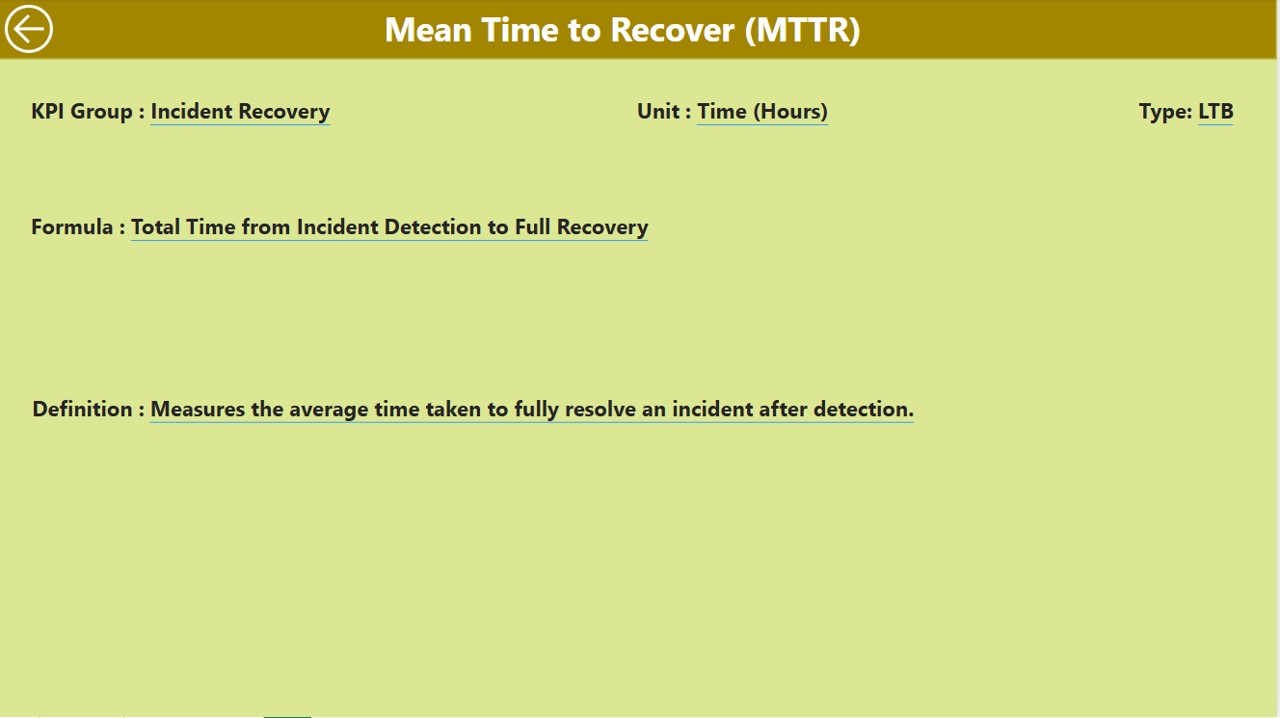
3. KPI Definition Page
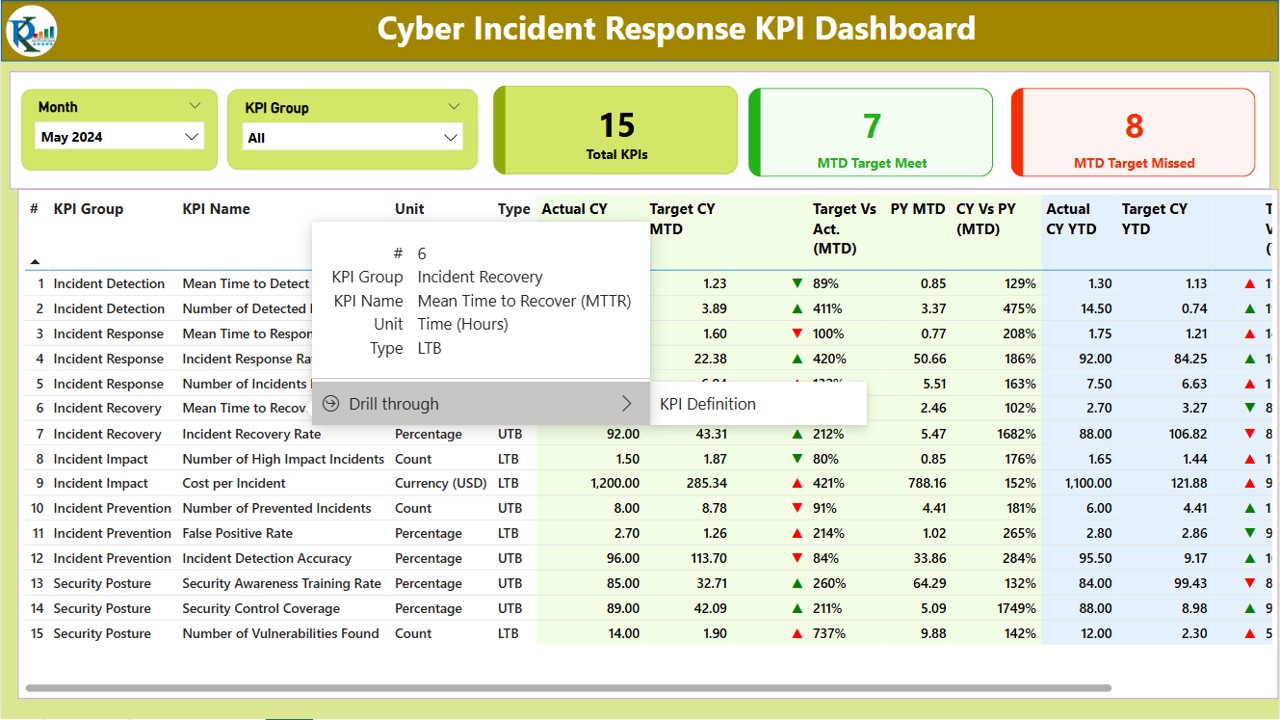
The KPI Definition Page is a hidden drill-through page that provides detailed information about each KPI, including:
-
Formula and Definition: This page displays the formula used to calculate the KPI, along with a brief definition to explain the purpose and importance of the KPI.
-
Drill-Through Navigation: From the summary page, users can drill through to the KPI Definition Page by selecting a KPI for deeper insights.
Advantages of Using the Cyber Incident Response KPI Dashboard in Power BI
Using the Cyber Incident Response KPI Dashboard in Power BI offers several significant advantages for organizations seeking to improve their cybersecurity monitoring and incident response. Let’s explore some of these benefits:
- Real-Time Data Visualization: Power BI provides real-time data visualization, which allows cybersecurity teams to quickly assess the current state of their incident response efforts. By visualizing data through charts, tables, and icons, users can immediately identify KPIs that need attention and make data-driven decisions.
- Enhanced Decision-Making: With easy access to critical cybersecurity metrics, decision-makers can respond quickly to emerging threats. The dashboard’s visual representation of MTD and YTD data, along with year-over-year comparisons, helps leaders prioritize incident response actions based on up-to-date insights.
- Comprehensive Monitoring: The dashboard tracks a variety of KPIs, from MTD performance to YTD trends and year-over-year comparisons, providing a holistic view of the organization’s cybersecurity posture. This comprehensive monitoring ensures that no critical aspect of cyber incident response is overlooked.
- Customizable Reporting: The use of slicers and drill-through capabilities allows users to customize their views based on their specific needs. This customization ensures that the right people have access to the most relevant data, enabling more efficient and effective reporting.
- Improved Incident Response Efficiency: By tracking KPIs such as “Target vs Actual” performance and comparing current year data with previous year figures, the dashboard helps identify areas where incident response efforts are falling short. This insight enables teams to address issues proactively and improve their incident response strategies.
Opportunity for Improvement in the Cyber Incident Response KPI Dashboard
Click to buy Cyber Incident Response KPI Dashboard in Power BI
While the Cyber Incident Response KPI Dashboard in Power BI offers powerful insights, there are a few opportunities for improvement:
- Integration with Other Cybersecurity Tools: Integrating the dashboard with other cybersecurity tools, such as SIEM (Security Information and Event Management) systems or firewalls, could provide even more comprehensive insights. This would allow the dashboard to automatically pull data from these systems for a more seamless and integrated response process.
- Automated Alerts and Notifications: Currently, the dashboard offers insights into past and present performance but lacks real-time automated alerts. Adding email or push notifications based on predefined thresholds (e.g., when a KPI falls below a certain value) would help teams respond faster to potential threats.
- Expanded Data Sources: The dashboard currently uses Excel as the primary data source. Expanding the data sources to include cloud-based databases, APIs, or third-party cybersecurity platforms could make the dashboard even more powerful and versatile.
Best Practices for Using the Cyber Incident Response KPI Dashboard in Power BI
To maximize the effectiveness of the Cyber Incident Response KPI Dashboard, follow these best practices:
- Regularly Update Data: Ensure that the Excel data feeding into the dashboard is updated regularly. This helps keep the KPI values accurate and reflective of the latest cybersecurity performance.
- Set Clear Targets: Establish clear, realistic targets for each KPI based on historical data and industry standards. Setting achievable targets ensures that the incident response team has specific goals to work towards.
- Monitor Trends Continuously: Use the KPI Trend Page to monitor performance trends over time. Regularly reviewing trends will help identify patterns and areas that need improvement, ensuring that your incident response efforts are continuously evolving.
- Collaborate Across Teams: Encourage cross-functional collaboration between IT, cybersecurity, and incident response teams. By sharing the insights from the dashboard, teams can align their efforts and work together to improve the organization’s overall cybersecurity posture.
Frequently Asked Questions (FAQs)
Click to buy Cyber Incident Response KPI Dashboard in Power BI
1. What are the main KPIs tracked in the Cyber Incident Response KPI Dashboard?
The dashboard tracks a variety of KPIs, including MTD (Month-to-Date), YTD (Year-to-Date), Target vs Actual performance, and comparisons between the current year and the previous year.
2. How do I customize the Cyber Incident Response KPI Dashboard?
You can customize the dashboard by selecting different KPIs from the slicer on the KPI Trend Page and using the slicers to filter data by month or KPI group on the Summary Page.
3. Can the Cyber Incident Response KPI Dashboard integrate with other tools?
While the current version uses Excel as the primary data source, future integrations with other cybersecurity tools like SIEM platforms could be implemented to expand its capabilities.
4. How often should I update the data for this dashboard?
It’s best to update the data at least once a month to keep the dashboard’s KPIs accurate and up-to-date. However, for more real-time tracking, you may want to update it more frequently.
5. Can I add additional KPIs to the dashboard?
Yes, you can add additional KPIs by updating the Excel data sources and modifying the Power BI dashboard to accommodate the new metrics.
Conclusion
The Cyber Incident Response KPI Dashboard in Power BI is an essential tool for organizations looking to improve their cybersecurity incident response. With its real-time data visualization, detailed performance metrics, and customizable features, this dashboard provides valuable insights that help organizations respond faster to emerging threats. By following best practices and continuously improving the dashboard, you can enhance your cybersecurity posture and ensure more efficient and effective incident response.
Visit our YouTube channel to learn step-by-step video tutorials