In today’s fast-paced business world, stakeholders need clear, visual, and actionable insights. That’s where a Sales and Marketing Stakeholder Reporting KPI Dashboard in Excel becomes a game changer. If you’re struggling to present your KPIs in a way that stakeholders can easily understand and act on, then this comprehensive guide is for you.
This article covers everything you need to know about this Excel-based dashboard—from its core features to best practices, real-world advantages, and frequently asked questions.
Click to Purchases Sales and Marketing Stakeholder Reporting KPI Dashboard in Excel
What is a Sales and Marketing Stakeholder Reporting KPI Dashboard?
A Sales and Marketing Stakeholder Reporting KPI Dashboard in Excel is a visual reporting tool that consolidates key performance indicators (KPIs) for both sales and marketing teams. It helps stakeholders monitor trends, compare performance against targets, and make informed decisions—all within a single, dynamic Excel workbook.
By using dropdowns, pivot tables, and conditional formatting, the dashboard updates in real-time based on the selected month or KPI.
Why Use Excel for Your Stakeholder Reporting Dashboard?
While many tools exist for data visualization, Excel remains a favorite due to its:
- Familiarity among business users
- Flexible customization options
- No need for additional software
- Excellent support for formulas, charts, and pivot tables
With the right structure, Excel can be just as powerful as expensive BI tools—and more accessible.
Key Features of the Sales and Marketing KPI Dashboard
This dashboard is divided into 7 well-designed worksheets that work together seamlessly:
Home Sheet
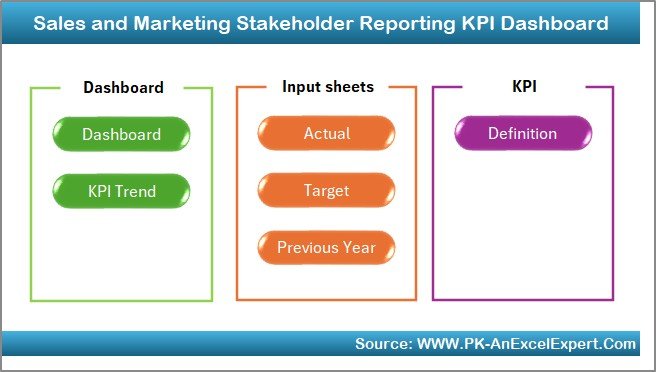
This serves as the index or landing page of the dashboard. It includes 6 buttons that quickly navigate to other tabs. This keeps the file user-friendly, especially for stakeholders who aren’t Excel experts.
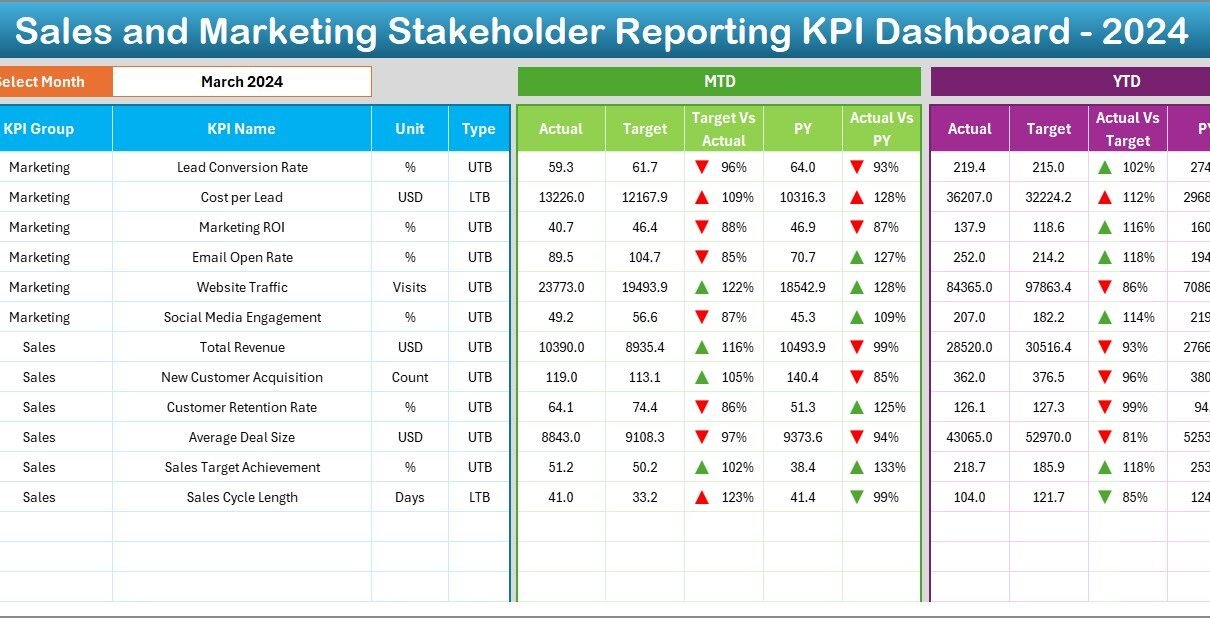
Dashboard Sheet Tab
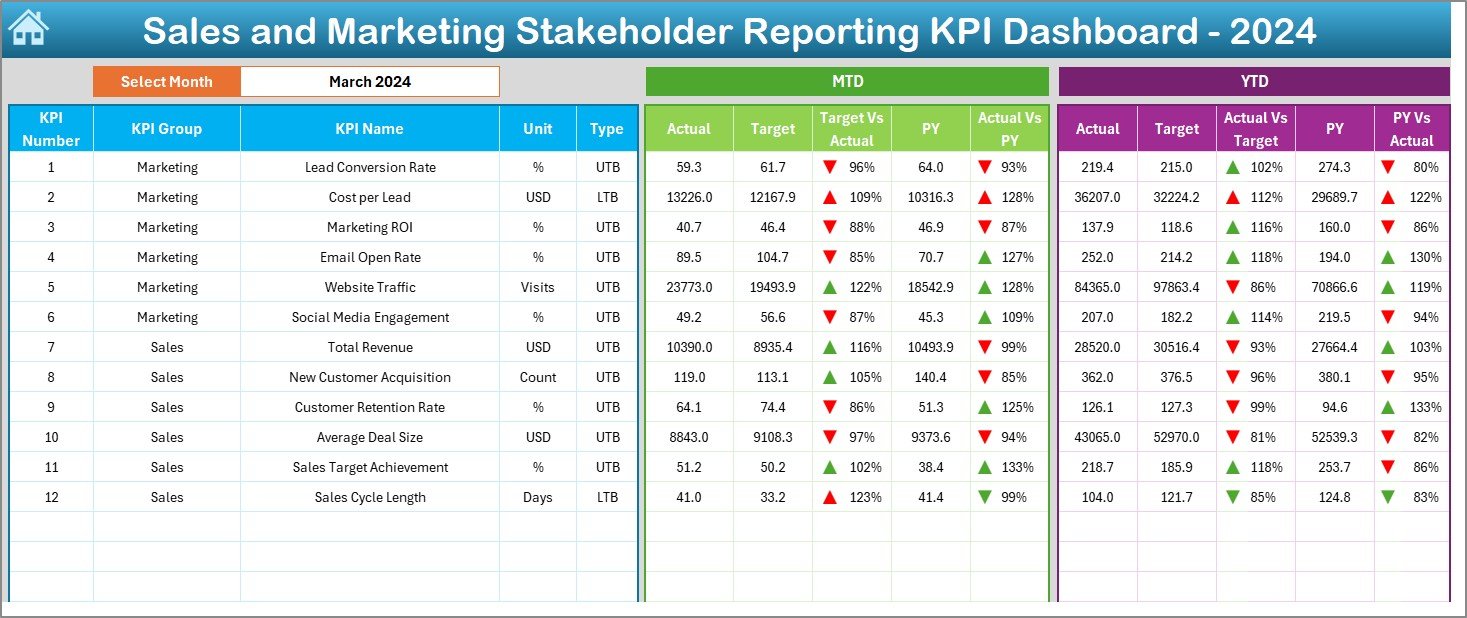
This is the main visualization hub. From cell D3, users can select a specific month from a dropdown list.
For the selected month, the dashboard displays:
- MTD Actual, Target, Previous Year values
- YTD Actual, Target, Previous Year data
- Conditional formatting with up/down arrows indicating performance vs. target and vs. previous year
KPI Trend Sheet Tab
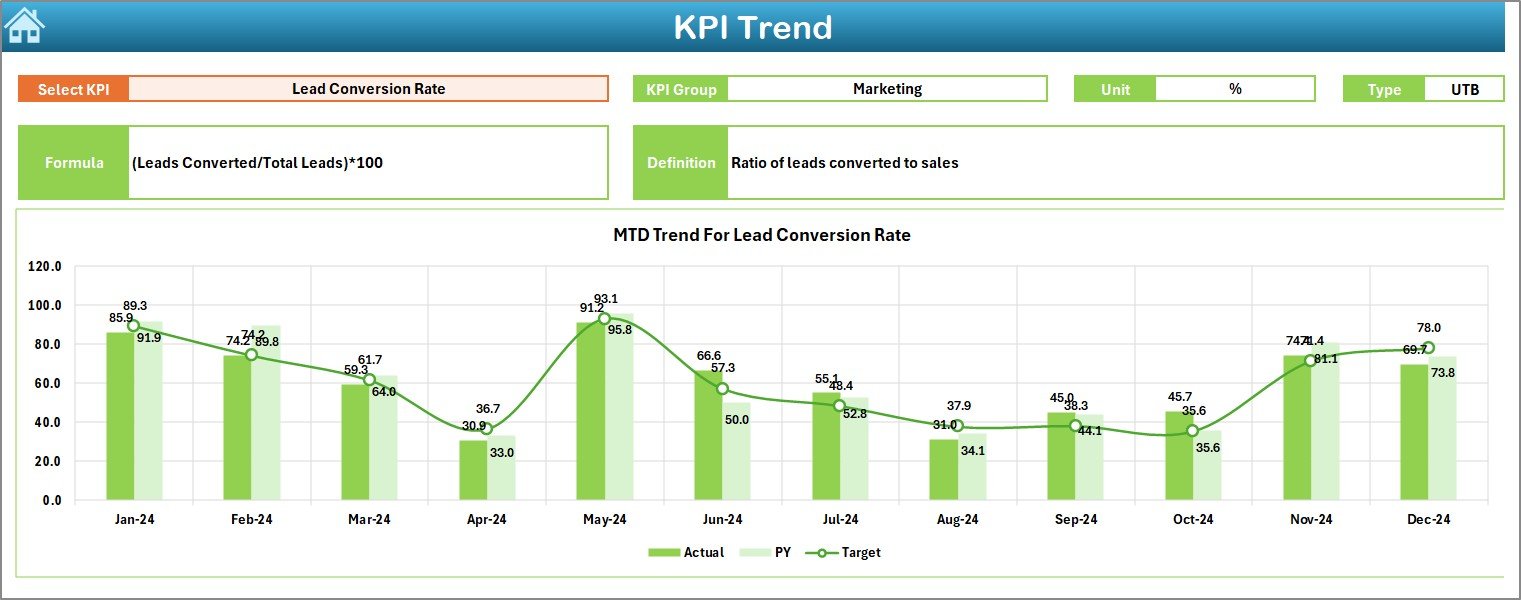
This sheet is all about tracking trends over time. Users can:
- Select a KPI name from cell C3
- View the KPI group, unit, definition, type (UTB or LTB), and formula
- Analyze trend charts for MTD and YTD across Actual, Target, and Previous Year values
Click to Purchases Sales and Marketing Stakeholder Reporting KPI Dashboard in Excel
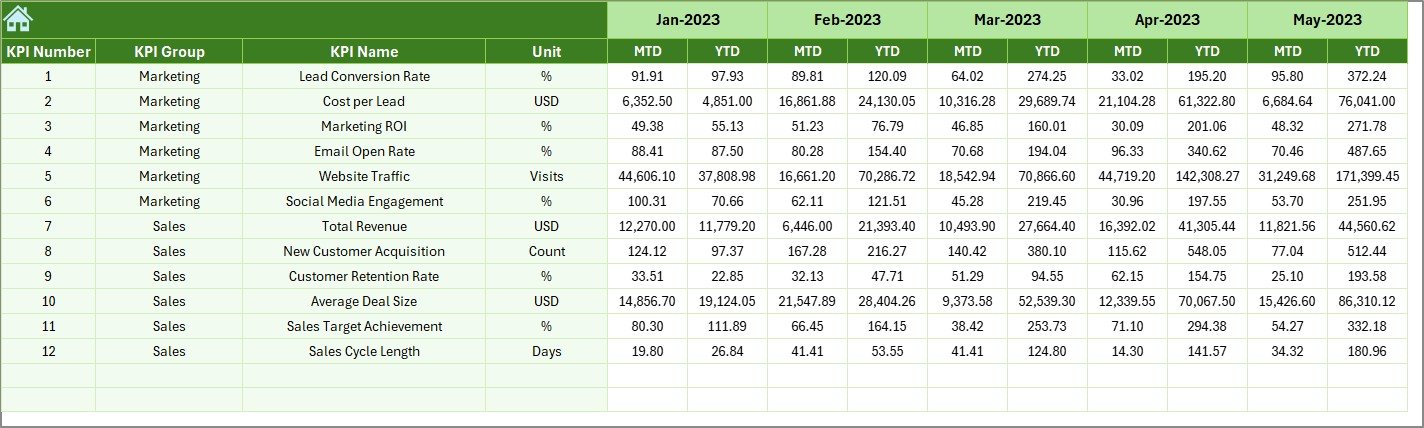
Actual Numbers Input Sheet
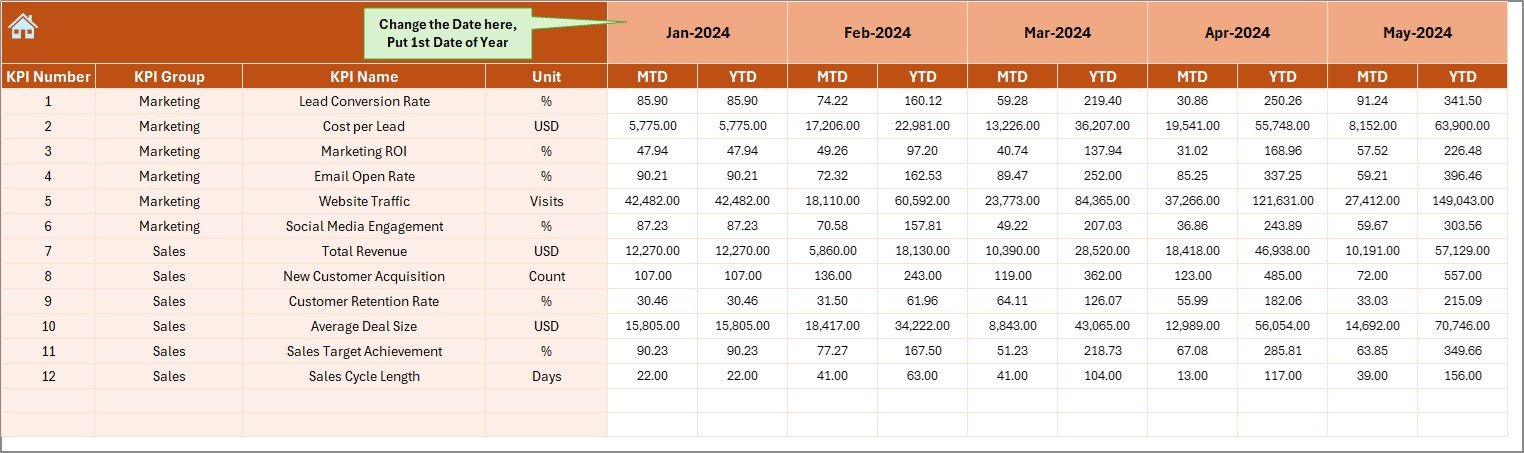
This is where you input actual values for each KPI. Users:
- Choose the first month of the year in cell E1
- Enter MTD and YTD values for each KPI by month
Target Sheet Tab
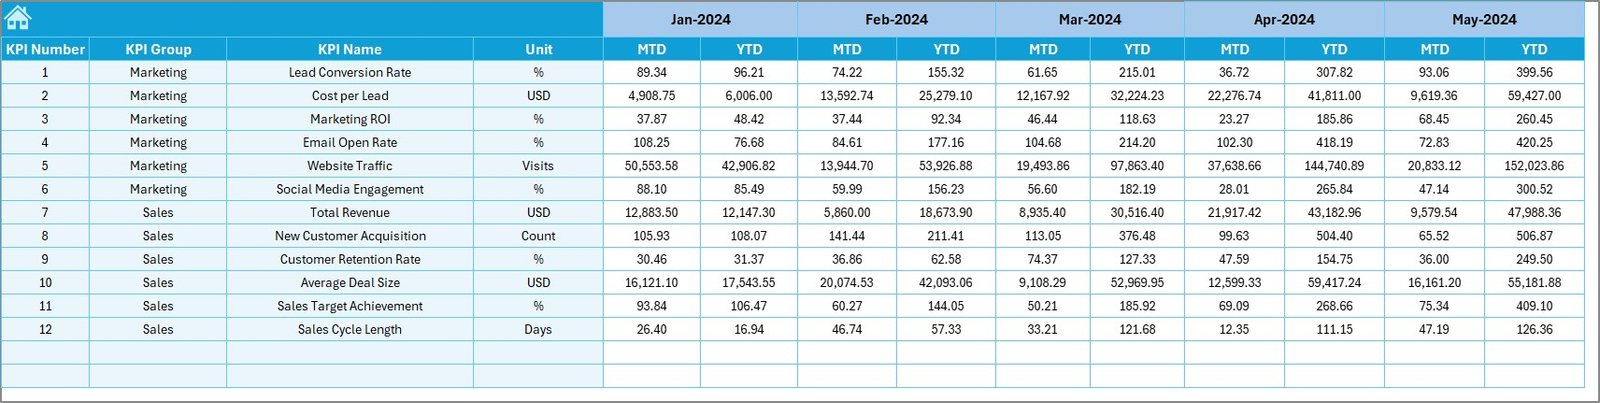
- Input monthly MTD and YTD targets for all KPIs. Keeping targets and actuals in separate sheets improves clarity and error reduction.
Previous Year Numbers Sheet
- Enter data from the previous year for benchmarking and comparative analysis.
KPI Definition Sheet Tab
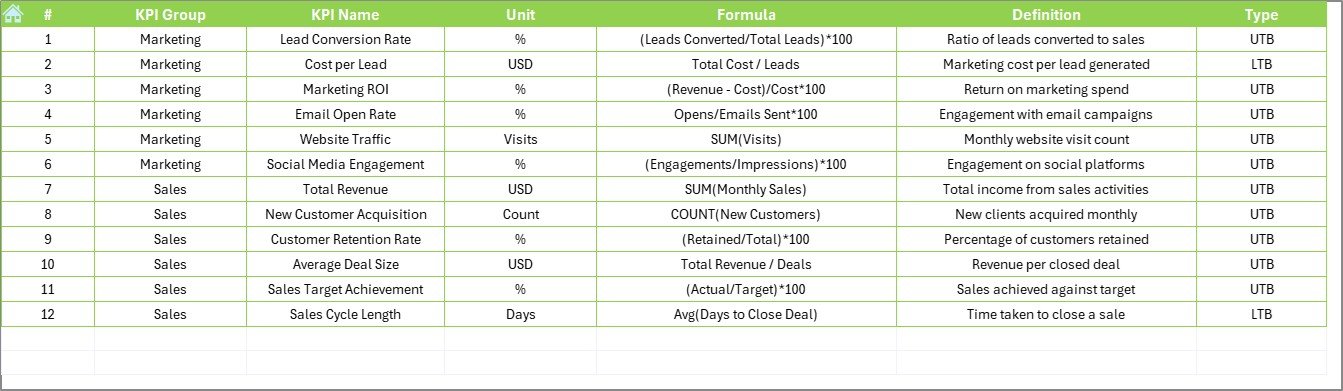
This sheet includes a comprehensive list of:
- KPI Name
- KPI Group
- Unit of Measurement
- Calculation Formula
- Brief Definition
- Type: UTB (Upper the Better) or LTB (Lower the Better)
Advantages of Using a Stakeholder KPI Dashboard in Excel
Here are the major benefits:
- Better Decision-Making: See KPI trends and act fast.
- Centralized Information: No more scattered reports.
- Time-Saving: Monthly dropdown auto-updates the dashboard.
- Stakeholder-Friendly: Easy navigation and clear visuals.
- Customizable: Add your company logo, branding, or new KPIs easily.
Best Practices for Creating Your KPI Dashboard
To make your dashboard truly effective, follow these tips:
- Define Clear KPIs: Only include KPIs that align with your business goals. Avoid clutter.
- Use Conditional Formatting Wisely: Up/down arrows quickly highlight performance. But don’t overuse colors or symbols.
- Keep Sheets Organized: Separate data entry from visualization. This prevents accidental overwrites and enhances accuracy.
- Update Definitions and Targets Regularly: Keep your KPI definition and target sheets updated with any new strategy.
- Make Navigation Easy: Use buttons or hyperlinks to help users move between sheets quickly.
- Always Back Up Your Data: Before making major changes, save a versioned backup.
What Types of KPIs Should You Track?
Here’s a list of sample KPIs typically used in Sales and Marketing Dashboards:
- Monthly Revenue
- Conversion Rate
- Customer Acquisition Cost (CAC)
- Customer Retention Rate
- Email Open Rate
- Website Traffic Growth
- Lead Response Time
- Return on Marketing Investment (ROMI)
- Monthly New Leads
- Sales Per Rep
Each of these can be defined in the KPI Definition tab with unit, formula, and type.
How Can Stakeholders Use the Dashboard?
Stakeholders use the dashboard to:
- Compare Actual vs Target: Quickly spot underperformance
- Monitor Monthly Trends: Analyze ups and downs across months
- Plan Budgets: Make informed budget allocations
- Forecast Sales: Use YTD patterns to predict outcomes
How to Customize the Dashboard?
You can customize it by:
- Changing logo and company name on the Home sheet
- Adding new KPIs in all relevant tabs
- Updating formulas or metrics based on evolving business needs
- Adjusting the theme or color scheme to match your brand
When Should You Update the Dashboard?
- Monthly: Enter MTD/YTD values
- Quarterly: Review KPI relevance and performance
- Yearly: Adjust targets and add/remove KPIs as required
Regular updates ensure data stays relevant and useful.
Who Should Use This Dashboard?
This dashboard is useful for:
- Sales Managers
- Marketing Directors
- Business Analysts
- Company Executives
- Financial Controllers
It provides a unified view for various teams to stay aligned and accountable.
Conclusion: Drive Success with Visual KPI Reporting
A well-structured Sales and Marketing Stakeholder Reporting KPI Dashboard in Excel transforms raw data into valuable insights. It helps teams stay focused, executives make informed decisions, and stakeholders feel confident in the company’s direction.
Frequently Asked Questions (FAQs)
Can I use this dashboard without advanced Excel skills?
Yes. It’s designed with simplicity in mind. You just need to enter data and use dropdowns.
Is it possible to add more KPIs later?
Absolutely. You can expand the KPI Definition, Data Input, and Dashboard tabs accordingly.
Can I use it for departments other than sales and marketing?
Yes. Just update the KPI groups and definitions. It works for finance, HR, or operations too.
What happens if I skip data entry for a month?
The dashboard will simply not show that month’s data. You can fill it in anytime later.
How do I share the dashboard with stakeholders?
You can export it as a PDF or share the Excel file via email or shared drive.
Click to Purchases Sales and Marketing Stakeholder Reporting KPI Dashboard in Excel
Visit our YouTube channel to learn step-by-step video tutorials
Watch the step-by-step video Demo: