In the world of digital marketing, understanding how your landing pages perform is crucial to making informed decisions that drive business growth. Landing pages are often the first interaction point between a potential customer and your brand. Therefore, tracking their performance is vital for optimizing conversion rates, enhancing user experience, and achieving your business goals. One of the most effective ways to monitor landing page performance is by using a Landing Page Performance KPI Dashboard in Excel.
In this comprehensive guide, we will explore the features of an effective Landing Page Performance KPI Dashboard, list all the key performance indicators (KPIs) you should track, and provide you with valuable insights on how to use Excel to analyze this data.
What is a Landing Page Performance KPI Dashboard?
A Landing Page Performance KPI Dashboard is a tool that helps you track the success of your landing pages based on key performance indicators (KPIs). It provides real-time data on various metrics such as traffic, conversion rates, bounce rates, and more. By utilizing this dashboard, marketers can evaluate the effectiveness of landing pages and identify areas for improvement.
Why Use a Landing Page Performance KPI Dashboard?
Tracking landing page performance is essential for the following reasons:
-
Conversion Optimization: Understanding how your landing pages are performing allows you to make changes that increase conversions.
-
Data-Driven Decisions: KPIs provide data-driven insights that can guide marketing strategies and decisions.
-
Performance Comparison: Comparing current data with previous years or targets helps you understand the impact of your marketing efforts.
-
Target Setting: By tracking KPIs, you can set realistic and measurable targets for your landing pages.
Key Features of the Landing Page Performance KPI Dashboard
The Landing Page Performance KPI Dashboard in Excel is designed to simplify the process of tracking and analyzing landing page performance. It comes with the following key features:
1. Home Sheet Tab
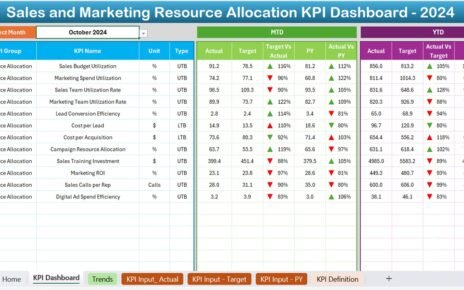
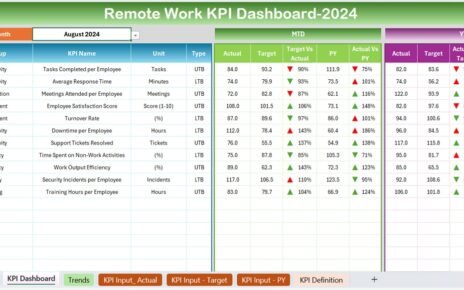
The Home Sheet Tab serves as an index where you can easily navigate to other sections of the dashboard. It provides quick links to the Dashboard, KPI Trend, Actual Number, Target, Previous Year Number, and KPI Definition sheets.

Click to buy Landing Page Performance KPI Dashboard in Excel
2. Dashboard Sheet Tab
The Dashboard Sheet Tab is where all the action happens. Here, you can:
-
View key metrics such as Month-to-Date (MTD) Actual, Year-to-Date (YTD) Actual, Target, and Previous Year (PY) data.
-
Compare Target vs. Actual and Previous Year vs. Actual using conditional formatting to highlight performance trends with up and down arrows.
-
Select a specific month using a dropdown menu (located in Range D3), which will update the entire dashboard to reflect the data for that month.

Click to buy Landing Page Performance KPI Dashboard in Excel
3. KPI Trend Sheet Tab
The KPI Trend Sheet Tab allows you to:
-
Select any KPI from a dropdown menu in Range C3.
-
View important details such as the KPI Group, Unit of Measurement, Type of KPI (whether it is Lower the Better or Upper the Better), Formula, and Definition of the selected KPI.

Click to buy Landing Page Performance KPI Dashboard in Excel
4. Actual Number Sheet Tab
In this sheet, you enter actual data for the Month-to-Date (MTD) and Year-to-Date (YTD) figures for a particular month. This data will be used to update the dashboard when you select a month.

5. Target Sheet Tab
Here, you input the target numbers for each KPI for both MTD and YTD. These targets will be used for comparison with the actual numbers to assess performance.

6. Previous Year Number Sheet Tab
Click to buy Landing Page Performance KPI Dashboard in Excel
This tab is used to input the previous year’s data for comparison with the current year’s performance. By doing so, you can track year-over-year performance and identify growth trends.

7. KPI Definition Sheet Tab
The KPI Definition Sheet Tab provides a structured space for defining each KPI, including:
-
KPI Name
-
KPI Group
-
Unit of Measurement
-
Formula
-
Definition
-

KPI Definition Sheet Tab
Advantages of Using a Landing Page Performance KPI Dashboard
Click to buy Landing Page Performance KPI Dashboard in Excel
A well-designed Landing Page Performance KPI Dashboard in Excel offers numerous advantages that can greatly enhance your digital marketing efforts. Here are the key benefits:
-
In-Depth Performance Insights: With a comprehensive set of KPIs, you get a clear view of how your landing pages are performing across multiple metrics.
-
Real-Time Monitoring: The dashboard allows you to track performance in real time, enabling you to make quick adjustments to improve results.
-
Easy Data Comparison: You can compare the current month’s data with previous months or even the previous year’s data, helping you identify trends and areas for improvement.
-
Improved Decision Making: By having access to key performance data, you can make data-driven decisions that enhance your landing page’s effectiveness.
-
Increased Conversions: Tracking KPIs like conversion rate and bounce rate allows you to identify potential problems and make changes that increase your landing page’s conversion rate.
Opportunities for Improvement in Landing Page Performance
Despite the powerful features of the KPI dashboard, there are always opportunities for further optimization. Here are some areas to consider:
-
A/B Testing: Use A/B testing to experiment with different elements of the landing page (e.g., headlines, CTA buttons, and layout) to improve KPIs like conversion rate and bounce rate.
-
Page Speed Optimization: If your page load speed is high, it could lead to a higher bounce rate. Work on reducing load times to improve user experience and lower bounce rates.
-
Mobile Optimization: Ensure your landing pages are mobile-friendly. With more users browsing on mobile devices, optimizing the mobile experience can significantly improve your KPIs.
Best Practices for Landing Page Performance
To get the most out of your Landing Page Performance KPI Dashboard, follow these best practices:
-
Keep the Design Simple and Focused: A clean, easy-to-navigate design will help users focus on the content and increase conversions.
-
Use Clear and Persuasive CTAs: Ensure that your call-to-action buttons are clear, concise, and persuasive. Use contrasting colors to make them stand out.
-
Test Different Variations: Regularly test different versions of your landing page to see which ones perform the best.
-
Track User Behavior: Use heatmaps and session recordings to understand how users interact with your page and identify potential friction points.
-
Optimize for Mobile: Since a significant portion of traffic comes from mobile devices, ensure that your landing page is responsive and provides a seamless experience on all screen sizes.
Conclusion
In conclusion, a Landing Page Performance KPI Dashboard in Excel is a powerful tool that can help marketers and business owners monitor and optimize their landing page performance. By tracking key performance indicators such as conversion rate, bounce rate, and page load speed, you can gain valuable insights into how well your landing page is performing. With this information, you can make data-driven decisions that drive better user experiences and higher conversion rates.
Frequently Asked Questions (FAQs)
What is a KPI in Landing Page Performance?
A KPI (Key Performance Indicator) in landing page performance refers to measurable data that helps assess the effectiveness of a landing page, such as conversion rates, bounce rates, and click-through rates.
Why is Conversion Rate Important?
Conversion rate is crucial because it indicates how well your landing page is turning visitors into customers, leads, or subscribers.
How Can I Improve Bounce Rate on My Landing Page?
Improving your bounce rate involves enhancing page load speed, simplifying navigation, providing relevant content, and ensuring your page matches user intent.
What Does MTD and YTD Mean?
MTD (Month-to-Date) refers to the performance metrics for the current month, while YTD (Year-to-Date) represents the performance from the beginning of the year until the current date.
How Can I Use the Dashboard to Track My KPIs?
You can use the dropdown menu on the Dashboard Sheet Tab to select the desired month, and the dashboard will automatically update the relevant data for comparison.
Visit our YouTube channel to learn step-by-step video tutorials
Watch the step-by-step video Demo:
Click to buy Landing Page Performance KPI Dashboard in Excel