In the ever-evolving world of digital marketing, Search Engine Marketing (SEM) plays a vital role in driving traffic and increasing conversions. SEM encompasses a variety of strategies, including paid search advertising and search engine optimization (SEO), to improve a website’s visibility on search engines like Google.
To effectively manage and monitor SEM campaigns, it’s essential to track specific Key Performance Indicators (KPIs) that provide actionable insights into your marketing efforts. A Search Engine Marketing KPI Dashboard in Excel is one of the most effective tools for this purpose. It allows marketers to visually track SEM performance, compare data, and make informed decisions based on current and historical metrics.
In this article, we will explore how a SEM KPI Dashboard works, list the most important KPIs to track, and explain how you can leverage Excel to build an efficient and customizable dashboard for SEM performance.
What is a Search Engine Marketing (SEM) KPI Dashboard?
A Search Engine Marketing KPI Dashboard is a visual representation of key metrics related to SEM campaigns, often created in Excel for easy data manipulation and real-time tracking. This dashboard consolidates performance data, such as clicks, impressions, conversions, and cost per click (CPC), allowing digital marketers to assess the effectiveness of their SEM strategies. By monitoring these KPIs, you can quickly identify what’s working, what needs improvement, and which areas require optimization.
Key Features of a SEM KPI Dashboard in Excel
A SEM KPI Dashboard in Excel typically consists of several key features and worksheets to ensure comprehensive tracking and analysis of SEM campaigns. Below are the core components of an effective SEM KPI Dashboard in Excel:
1. Home Sheet Tab
The Home Sheet Tab acts as an overview or index of the entire dashboard. It contains navigation links to all other sections of the dashboard, such as the Dashboard Sheet, KPI Trend Sheet, Actual Number Sheet, Target Sheet, Previous Year Number Sheet, and KPI Definition Sheet. This structure makes it easy to jump from one worksheet to another and get a holistic view of your SEM performance.

Click to buy Search Engine Marketing KPI Dashboard in Excel
2. Dashboard Sheet Tab
The Dashboard Sheet Tab is the main hub for your SEM metrics. It displays key performance indicators in a clear and concise format. Some of the key features on this sheet include:
-
MTD Actual, YTD Actual, and Target metrics, enabling you to track monthly and yearly performance.
-
Previous Year Data (PY) for year-over-year comparisons.
-
Target vs Actual and PY vs Actual performance comparisons, with color-coded arrows (up or down) based on performance, using conditional formatting for quick insights.
-
The ability to select months via a dropdown menu (Range D3) to dynamically update the data for the selected period.

Click to buy Search Engine Marketing KPI Dashboard in Excel
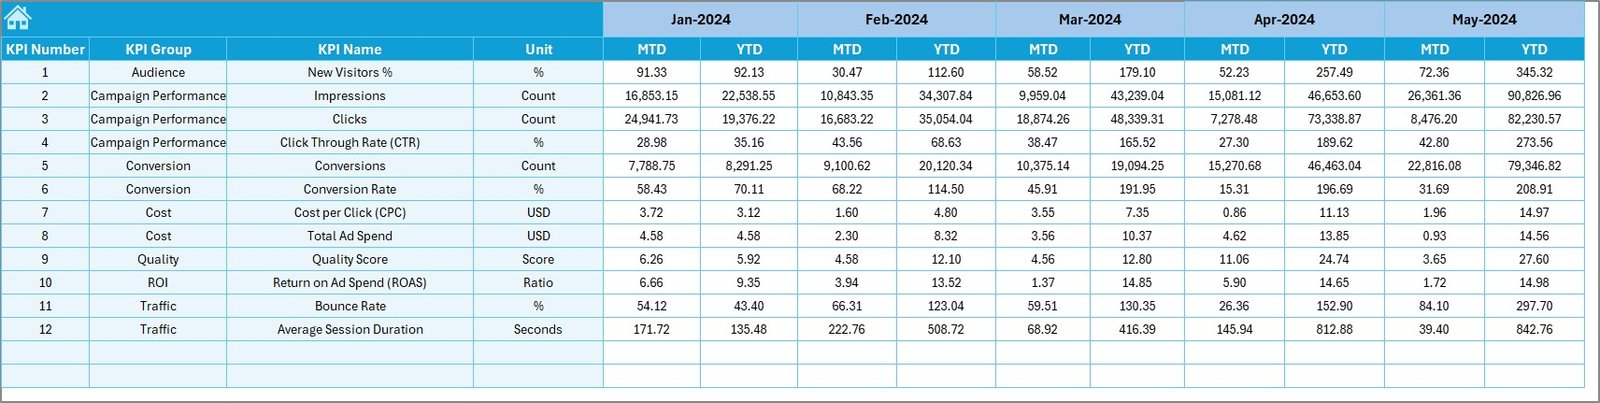
3. KPI Trend Sheet Tab
The KPI Trend Sheet Tab allows you to track the performance trends of specific KPIs. It features a dropdown menu (Range C3) to select the KPI you want to analyze. This sheet displays essential details such as:
-
KPI Group (e.g., Clicks, Conversions, Cost)
-
Unit of Measurement (e.g., Percent, Dollars, Number of Clicks)
-
Type of KPI (whether it’s Upper the Better or Lower the Better)
-
Formula and Definition for each KPI, ensuring that each metric is well-understood and calculated correctly.
4. Actual Number Sheet Tab
The Actual Number Sheet Tab is where you input the actual data for Month-to-Date (MTD) and Year-to-Date (YTD) performance. You can change the month from Range E1, which allows you to track real-time performance by adjusting the data input for any given period.

5. Target Sheet Tab
In the Target Sheet Tab, you can input target goals for each KPI, both on a monthly (MTD) and yearly (YTD) basis. These targets serve as benchmarks to measure your actual SEM performance and help in setting realistic goals for future campaigns.
Click to buy Search Engine Marketing KPI Dashboard in Excel
6. Previous Year Number Sheet Tab
This tab enables you to enter the previous year’s data for each KPI, which will be used to compare current performance with historical data. This year-over-year comparison is critical for assessing progress and identifying areas for improvement.

7. KPI Definition Sheet Tab
The KPI Definition Sheet Tab is where you define all the KPIs, including:
-
KPI Name
-
KPI Group
-
Unit of Measurement
-
Formula
-
Definition
This tab acts as a reference for understanding how each KPI is calculated and its significance in evaluating SEM performance.

Click to buy Search Engine Marketing KPI Dashboard in Excel
Advantages of Using a SEM KPI Dashboard
There are several advantages to using a Search Engine Marketing KPI Dashboard in Excel. Here are some key benefits:
-
Comprehensive Data Tracking: A KPI dashboard provides a centralized location for all SEM data, making it easier to track performance across different campaigns and metrics.
-
Informed Decision Making: By having real-time access to your SEM KPIs, you can make quick decisions about which aspects of your campaigns need attention or optimization.
-
Enhanced ROI Tracking: With accurate data on CPC, conversion rates, and other KPIs, you can calculate the return on investment (ROI) for each campaign.
-
Goal Setting and Benchmarking: You can set targets for each KPI and track whether your SEM campaigns are meeting, exceeding, or falling short of expectations.
-
Historical Comparison: The ability to compare current data with previous years allows you to assess growth trends and identify areas for improvement.
Opportunities for Improvement in SEM Performance
Although a SEM KPI Dashboard can provide a wealth of data, there is always room for improvement. Here are some opportunities to optimize your SEM campaigns:
-
Improve Quality Score: If your Quality Score is low, focus on improving ad relevance, landing page experience, and expected CTR. This will improve your Ad Rank and reduce your CPC.
-
A/B Testing Ads: Continuously test different ad copy, targeting options, and bidding strategies to find what works best.
-
Optimize Landing Pages: Ensure that your landing pages are relevant, fast-loading, and user-friendly to increase conversions and lower bounce rates.
-
Budget Allocation: Regularly assess your ad spend to ensure that you’re investing in the most profitable keywords and campaigns.
-
Mobile Optimization: As mobile usage continues to rise, ensure that your SEM ads and landing pages are optimized for mobile devices.
Best Practices for Search Engine Marketing (SEM)
Click to buy Search Engine Marketing KPI Dashboard in Excel
To get the most out of your SEM efforts, consider following these best practices:
-
Focus on High-Quality Keywords: Conduct thorough keyword research to identify high-converting keywords that resonate with your target audience.
-
Use Negative Keywords: Negative keywords help filter out irrelevant traffic, reducing wasted ad spend and improving the overall performance of your SEM campaigns.
-
Leverage Dynamic Keyword Insertion: This technique allows your ad copy to dynamically adjust based on the search terms, increasing relevance and CTR.
-
Monitor and Adjust Bids: Regularly review your CPC bids and adjust them based on performance to maximize ROI.
-
Utilize Ad Extensions: Use ad extensions (such as site links, callouts, and structured snippets) to provide more information and increase CTR.
Conclusion
A Search Engine Marketing KPI Dashboard in Excel is an invaluable tool for digital marketers looking to optimize their SEM campaigns. It provides a clear and organized way to track key performance indicators, allowing marketers to make data-driven decisions that enhance their campaigns’ effectiveness. By focusing on the right KPIs, using best practices, and continuously improving based on data, businesses can maximize their SEM performance and achieve significant growth in their online visibility and conversion rates.
Frequently Asked Questions (FAQs)
Click to buy Search Engine Marketing KPI Dashboard in Excel
What is a KPI in SEM?
A KPI (Key Performance Indicator) in SEM refers to measurable data that helps evaluate the success of an SEM campaign, such as CTR, CPC, and conversion rate.
How Do I Improve My SEM Campaign Performance?
Improving SEM campaign performance involves optimizing ad copy, targeting high-converting keywords, improving landing pages, and adjusting bids.
Why is Click-Through Rate (CTR Important in SEM?
CTR indicates how effective your ad is in encouraging clicks. A higher CTR means your ad is more relevant to your audience.
What is Quality Score in SEM?
Quality Score is a Google metric that assesses the relevance of your ad, keywords, and landing page. A higher Quality Score leads to better ad positioning at lower costs.
How Often Should I Update My SEM KPI Dashboard?
Your SEM KPI Dashboard should be updated regularly, ideally on a monthly or weekly basis, to ensure that the data is current and actionable.
Visit our YouTube channel to learn step-by-step video tutorials
Watch the step-by-step video Demo:
Click to buy Search Engine Marketing KPI Dashboard in Excel