Are you struggling to monitor and improve employee retention in your sales and marketing teams? Do you want a simple, yet powerful way to track performance metrics without using complex software? If yes, then you need a Sales and Marketing Employee Retention KPI Dashboard in Excel.
This comprehensive Excel-based dashboard template is designed to help HR professionals, team leaders, and business owners easily monitor, analyze, and improve their employee retention strategies within sales and marketing departments. Let’s explore how this dashboard can transform your retention analysis process.
Click to Purchases Sales and Marketing Employee Retention KPI Dashboard in Excel
What is a Sales and Marketing Employee Retention KPI Dashboard?
A Sales and Marketing Employee Retention KPI Dashboard in Excel is a ready-to-use tracking tool that allows organizations to monitor the key performance indicators (KPIs) related to employee retention specifically for sales and marketing roles. It provides monthly and yearly trends, compares actual performance with targets, and highlights areas of improvement.
Unlike generic dashboards, this template is tailored to the unique dynamics of sales and marketing teams, where high turnover can hurt performance and consistency.
Dashboard Structure: What Does It Include?
The Excel dashboard is divided into 7 interactive and user-friendly worksheets, each playing a vital role in capturing, analyzing, and displaying KPI data.
Home Sheet

- Acts as a central navigation hub
- Includes 6 quick buttons to jump to different sheets
- Makes user experience seamless and fast
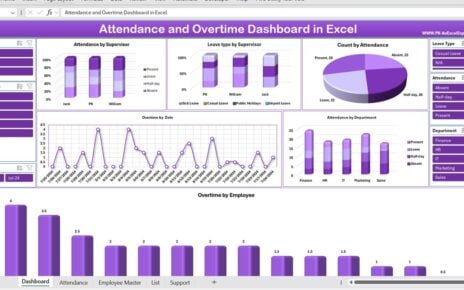
Dashboard Sheet

- This is the main visualization sheet
- You can select the month from a dropdown (Cell D3)
Displays:
- MTD Actual vs Target vs Previous Year
- YTD Actual vs Target vs Previous Year
- Includes Conditional Formatting with up/down arrows for quick insights
KPI Trend Sheet

Select a KPI name from a dropdown in Cell C3
Displays:
- KPI Group
- Unit
- KPI Type (UTB or LTB)
- Formula
- Definition
- Shows MTD & YTD trends with dynamic charts
Click to Purchases Sales and Marketing Employee Retention KPI Dashboard in Excel
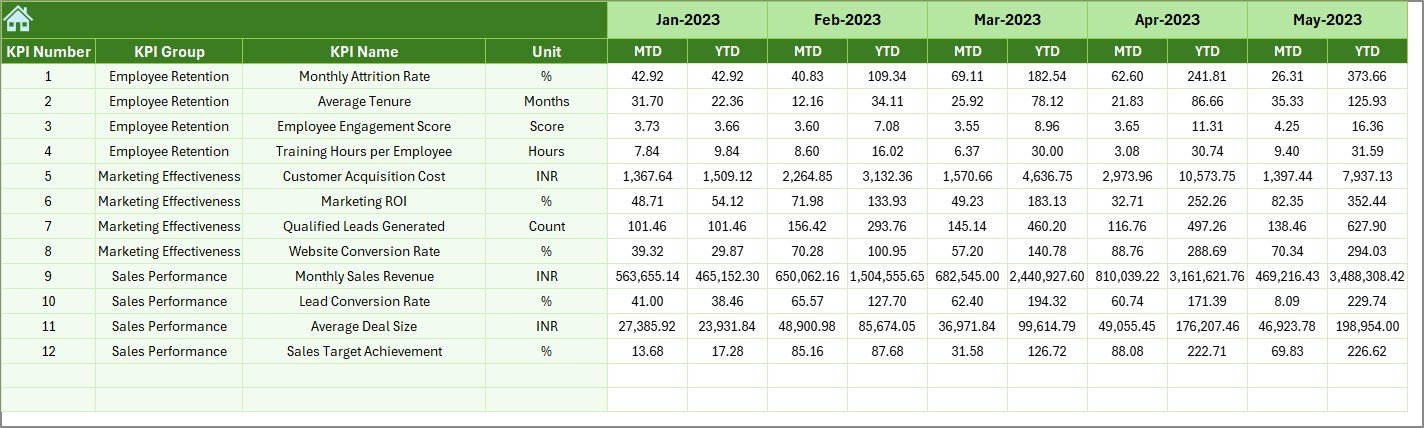
Actual Numbers Input Sheet

- Here you input actual MTD & YTD values for each month
- Cell E1 lets you define the start month of the year
- Fully dynamic – change the month, and data updates automatically
Target Sheet

- Input monthly and yearly target values for each KPI
- Helps in setting realistic performance expectations
Previous Year Numbers Sheet
- Enter last year’s data for better comparison and progress analysis
KPI Definition Sheet

Define all KPIs with:
- KPI Name
- Group
- Unit
- Formula
- Clear definitions
Key KPIs Included in the Dashboard
Some of the commonly used KPIs in this dashboard include:
- Employee Turnover Rate
- Retention Rate
- Absenteeism Rate
- Time to Fill
- Employee Engagement Score
- New Hire 90-Day Retention
- Cost of Employee Turnover
Each KPI is:
- Clearly defined
- Categorized as LTB (Lower the Better) or UTB (Upper the Better)
- Equipped with easy-to-understand formulas
Advantages of Using This KPI Dashboard
✅ Visual Insights: The dashboard makes it super easy to visualize trends and compare MTD/YTD performance across months and years.
✅ Informed Decision-Making: You get a data-driven foundation to take employee retention actions, whether it’s refining onboarding or improving work culture.
✅ Fully Editable: You can edit formulas, KPIs, thresholds, and visuals as per your organizational needs.
✅ Time-Saving: Skip hours of manual Excel work. Just input your numbers, and the dashboard updates itself.
Best Practices for Sales and Marketing Employee Retention KPIs
To make the most out of your dashboard, follow these best practices:
- Update Regularly: Always enter actual, target, and previous year numbers at the start of each month.
- Engage Stakeholders: Share the dashboard with sales and marketing heads. Use it during performance reviews.
- Define KPI Ownership: Assign ownership of each KPI to relevant team members. Accountability drives results.
- Set Realistic Targets: Base your targets on historical data, industry benchmarks, and business goals.
- Analyze Trends, Not Just Numbers: Focus on what the trends say. Are retention rates improving? Is engagement rising?
- Keep it Simple: Use clear naming conventions. Avoid overloading the dashboard with too many KPIs.
Conclusion
Employee retention in sales and marketing is crucial for maintaining momentum, client relationships, and long-term success. The Sales and Marketing Employee Retention KPI Dashboard in Excel simplifies the entire retention monitoring process. With just a few clicks and regular updates, you gain access to powerful insights that help reduce turnover, improve engagement, and drive performance.
Say goodbye to manual data handling and hello to strategic employee retention with this smart Excel dashboard.
Frequently Asked Questions (FAQs)
❓ What is the purpose of a retention KPI dashboard?
The purpose is to track and analyze key metrics related to how well your organization retains employees over time.
❓ How often should I update the dashboard?
Update it every month to ensure accurate MTD and YTD insights.
❓ Can I modify the KPIs in this Excel template?
Yes, the dashboard is fully editable. You can add, remove, or update KPIs as per your needs.
❓ Is this template suitable for small teams?
Absolutely. Whether you have 5 or 50 employees, this dashboard is flexible enough to fit all team sizes.
Click to Purchases Sales and Marketing Employee Retention KPI Dashboard in Excel
Visit our YouTube channel to learn step-by-step video tutorials