In today’s fast-paced business world, ensuring financial accuracy and accountability is more important than ever. Companies must maintain the highest quality in their finance and accounting operations to gain trust, reduce risks, and make better decisions. One of the most effective tools to track and maintain this quality is the Finance and Accounting Quality Assurance KPI Dashboard in Excel.
This article is your ultimate guide to understanding what this dashboard is, why it’s important, how it works, and how you can make the most out of it.
Click to Purchases Finance and Accounting Quality Assurance KPI Dashboard
What is a Finance and Accounting Quality Assurance KPI Dashboard?
A Finance and Accounting Quality Assurance KPI Dashboard is an Excel-based tool designed to help organizations monitor, evaluate, and improve their financial processes. It tracks key performance indicators (KPIs) that reflect the accuracy, efficiency, compliance, and timeliness of financial operations.
Rather than relying on manual reports or scattered spreadsheets, this dashboard centralizes all vital metrics in one place. As a result, it becomes easier for finance professionals, auditors, and managers to assess performance trends and pinpoint areas that need attention.
Key Features of the Dashboard
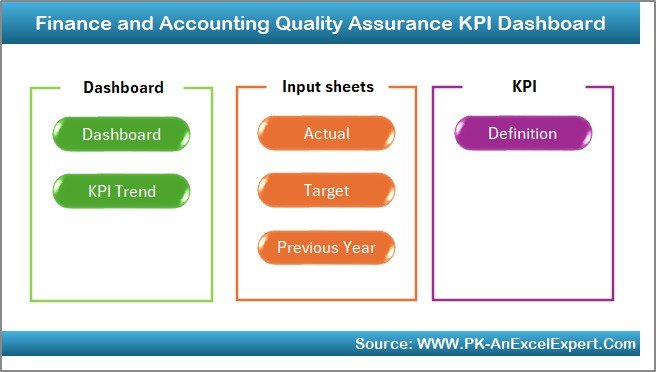
This dashboard comes with seven well-structured worksheets, each serving a specific purpose:
Home Sheet
- Serves as the dashboard’s control panel.
- Includes 6 clickable buttons that take you to respective sheets quickly.
Dashboard Sheet Tab
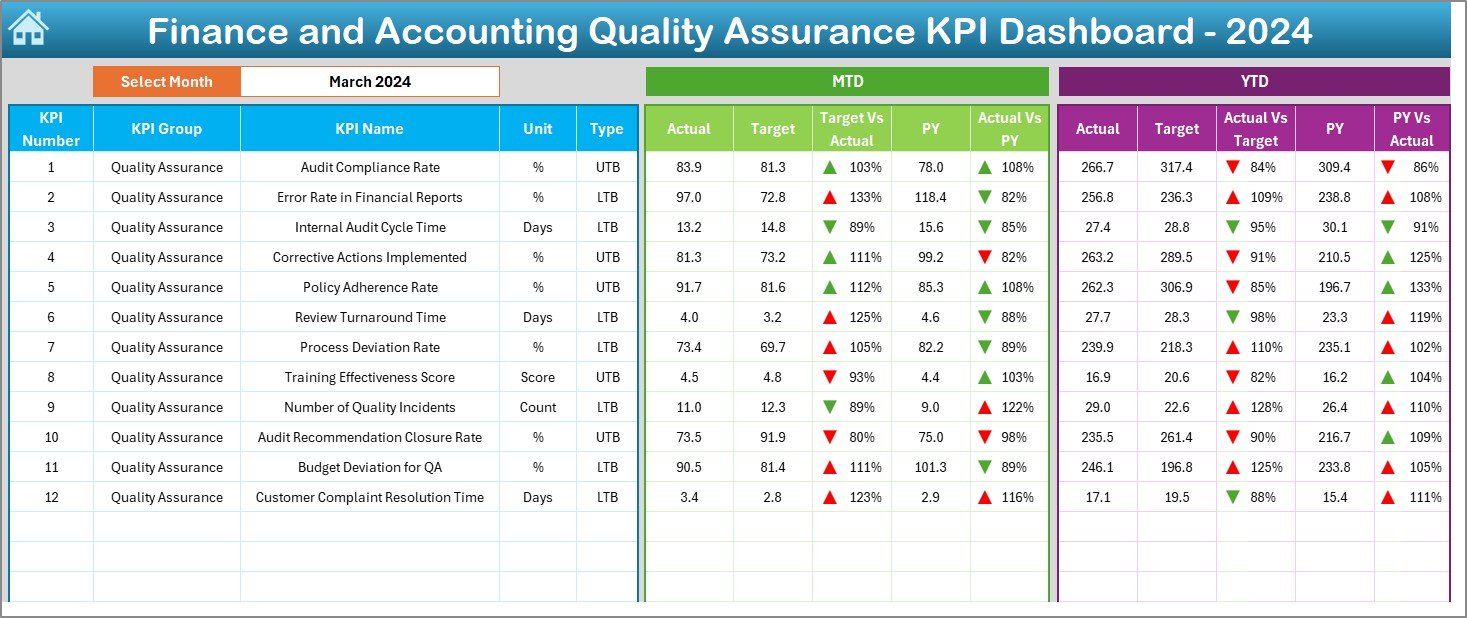
- Displays all KPI metrics visually and numerically.
- Range D3 contains a drop-down menu to select any month.
- Automatically updates MTD (Month-to-Date) and YTD (Year-to-Date) data for Actual, Target, and Previous Year.
- Highlights performance changes using up/down arrows with conditional formatting.
KPI Trend Sheet Tab
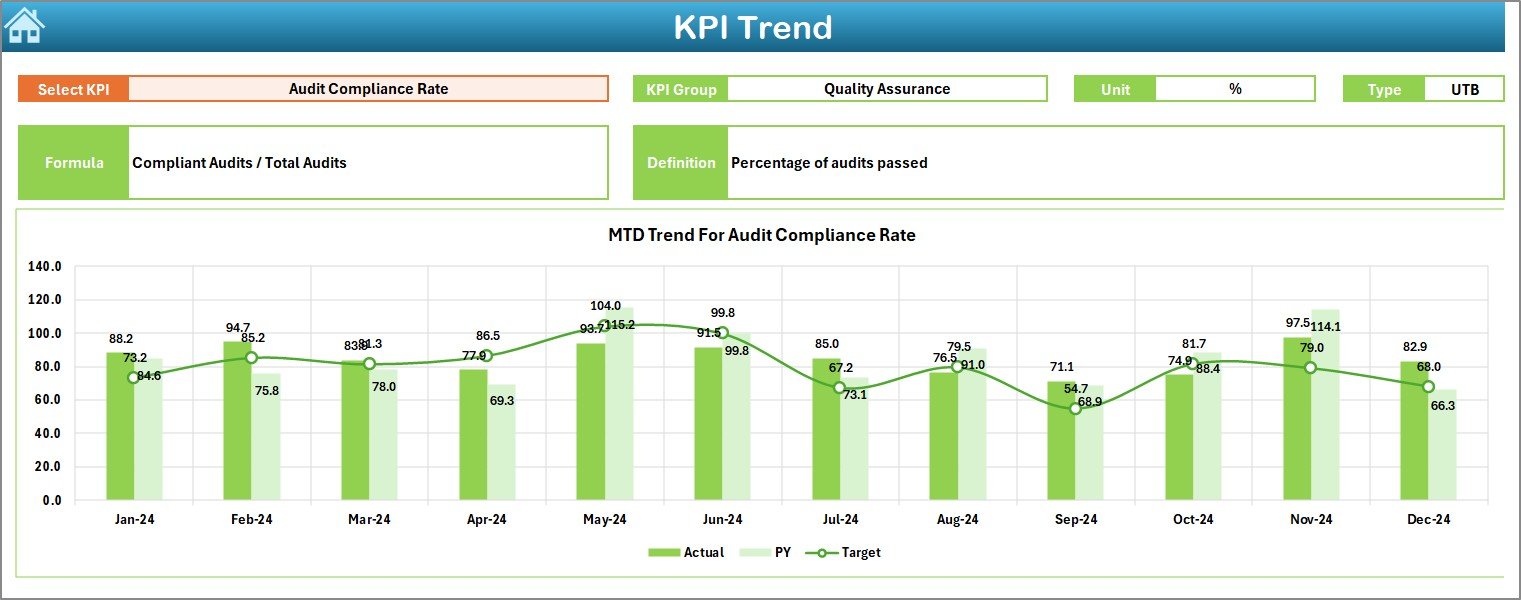
- Lets you select a KPI from a drop-down (range C3).
- Displays:
- KPI Group
- Unit
- Type (LTB or UTB)
- Formula and Definition
- Provides trend charts for MTD and YTD Actual, Target, and PY numbers.
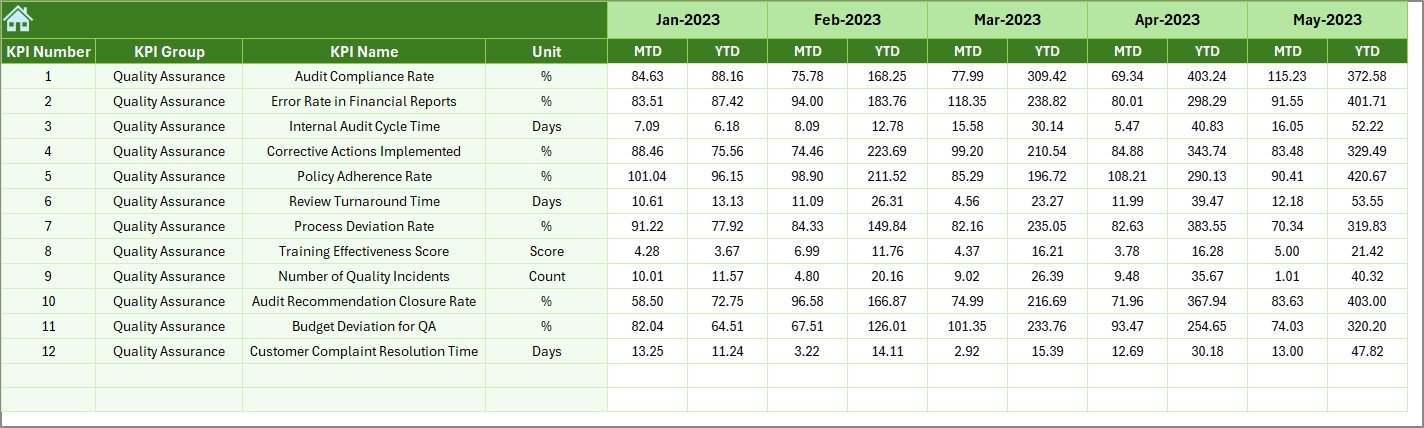
Actual Numbers Input Sheet

- Input MTD and YTD values month-wise.
- Change the first month of the fiscal year in range E1.
Target Sheet Tab

- Input monthly and YTD targets for all KPIs.
Previous Year Number Sheet Tab
- Add last year’s MTD and YTD values for comparison.
KPI Definition Sheet Tab

- Enter details like:
- KPI Name
- KPI Group
- Unit
- Formula
- Definition
Click to Purchases Finance and Accounting Quality Assurance KPI Dashboard
Advantages of Finance and Accounting Quality Assurance KPI Dashboard
✅ 1. Centralized Data Management
All your finance quality KPIs are stored and managed in one place, removing the need for multiple tools.
✅ 2. Instant Month-wise Insights
With one-click month selection, you can instantly see how each KPI is performing for the selected period.
✅ 3. Better Decision-Making
Compare Actual vs. Target vs. Previous Year to spot trends, make adjustments, and optimize strategies.
✅ 4. Enhanced Accuracy
Manual errors are reduced through structured input sheets and automated data visuals.
✅ 5. Professional Visual Representation
Trend charts and conditional formatting add clarity and make presentations boardroom-ready.
Why You Need Quality Assurance KPIs in Finance
Quality assurance isn’t just for manufacturing or customer service. Finance departments also need to maintain accuracy and compliance. Using KPIs helps in:
- Tracking invoice processing times
- Monitoring reconciliation delays
- Identifying data entry errors
- Evaluating audit findings
- Ensuring adherence to accounting standards
These KPIs help build transparency, promote accountability, and keep stakeholders informed.
📘 Common Quality Assurance KPIs in Finance and Accounting
Here are some popular KPIs tracked in this dashboard:
- Invoice Accuracy Rate
- Error Rate in Financial Statements
- Time to Close Books (MTD/YTD)
- Audit Issue Resolution Time
- Reconciliation Timeliness
- Budget Variance %
- Compliance Rate
- Transaction Processing Time
- Manual Journal Entry Rate
- Aging of Open Items
- Internal Control Effectiveness Score
- Customer Invoice Dispute Rate
Each of these KPIs plays a vital role in ensuring financial data quality.
📚 Best Practices for Using the KPI Dashboard
Follow these best practices to get the most out of your dashboard:
1. Update Data Monthly
Always enter MTD and YTD numbers regularly to keep the dashboard current.
2. Define KPIs Clearly
Ensure every KPI has a clear definition, formula, and classification (LTB or UTB).
3. Set Realistic Targets
Use historical data and industry benchmarks to set achievable targets.
4. Review Trends Frequently
Use the trend chart to detect early warning signs or improvement areas.
5. Automate Where Possible
Use Excel formulas and drop-downs to minimize manual errors and increase efficiency.
6. Train Your Team
Ensure all stakeholders know how to read and use the dashboard.
❓ How to Customize the Dashboard for Your Organization?
Every organization has its own set of processes and priorities. So, customize the dashboard by:
- Adding or removing KPIs
- Adjusting the fiscal start month
- Changing conditional formatting rules
- Adding more sheets for department-level KPIs
- Modifying formulas to fit your internal definitions
Who Can Use This Dashboard?
This dashboard is highly versatile. It’s useful for:
- Finance Managers
- Accountants
- Internal Auditors
- Compliance Officers
- CFOs
- Finance Analysts
It’s suitable for small businesses, large enterprises, non-profits, and government organizations.
Conclusion
A Finance and Accounting Quality Assurance KPI Dashboard in Excel is more than a spreadsheet. It’s a powerful tool that drives operational transparency, financial accuracy, and strategic improvements. By monitoring the right KPIs with this dashboard, your finance team can ensure top-notch quality in every transaction and report.
❓ Frequently Asked Questions
1. Can I use this dashboard without Excel expertise?
Yes. The dashboard is beginner-friendly and comes with drop-downs and guided input sheets.
2. Is this dashboard suitable for startups?
Absolutely! It scales well for both small teams and large enterprises.
3. How many KPIs can I track in this dashboard?
There’s no limit. However, we recommend keeping it under 30 for clarity and simplicity.
4. Can I add my own KPIs?
Yes. Simply add them to the KPI Definition sheet and update the actual, target, and PY values.
Click to Purchases Finance and Accounting Quality Assurance KPI Dashboard
Visit our YouTube channel to learn step-by-step video tutorials