
Operational efficiency is the backbone of any successful business. Organizations constantly strive to optimize their operations, reduce waste, and enhance productivity. Key Performance Indicators (KPIs) are essential tools for measuring and tracking the efficiency of various business processes. In this article, we explore how to create an Operational Efficiency KPI Dashboard in Excel, a comprehensive tool designed to monitor and improve operational efficiency.
This Excel-based dashboard is a ready-to-use template that provides a detailed overview of operational efficiency. With seven integrated worksheets, this dashboard allows you to manage and visualize KPIs, track progress over time, and make informed decisions.
Let’s dive into the features, benefits, and how to use this powerful dashboard.
Key Features of the Operational Efficiency KPI Dashboard
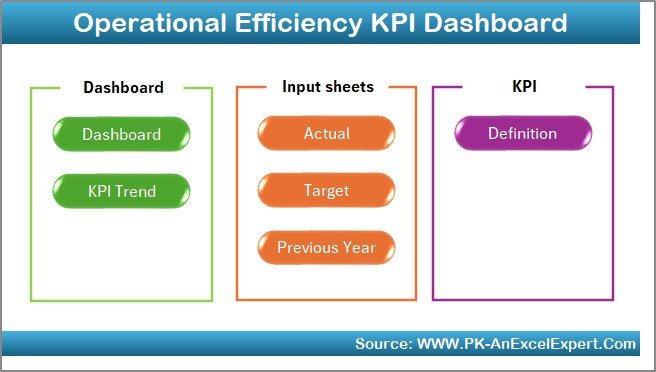
The Operational Efficiency KPI Dashboard in Excel offers a range of features designed to track and measure key business processes effectively. Below are the main worksheets that structure this template:
1. Home Sheet Tab
The Home tab serves as the central navigation point for all other worksheets. You can easily jump to any other worksheet from here.
Click to buy Operational Efficiency KPI Dashboard in Excel
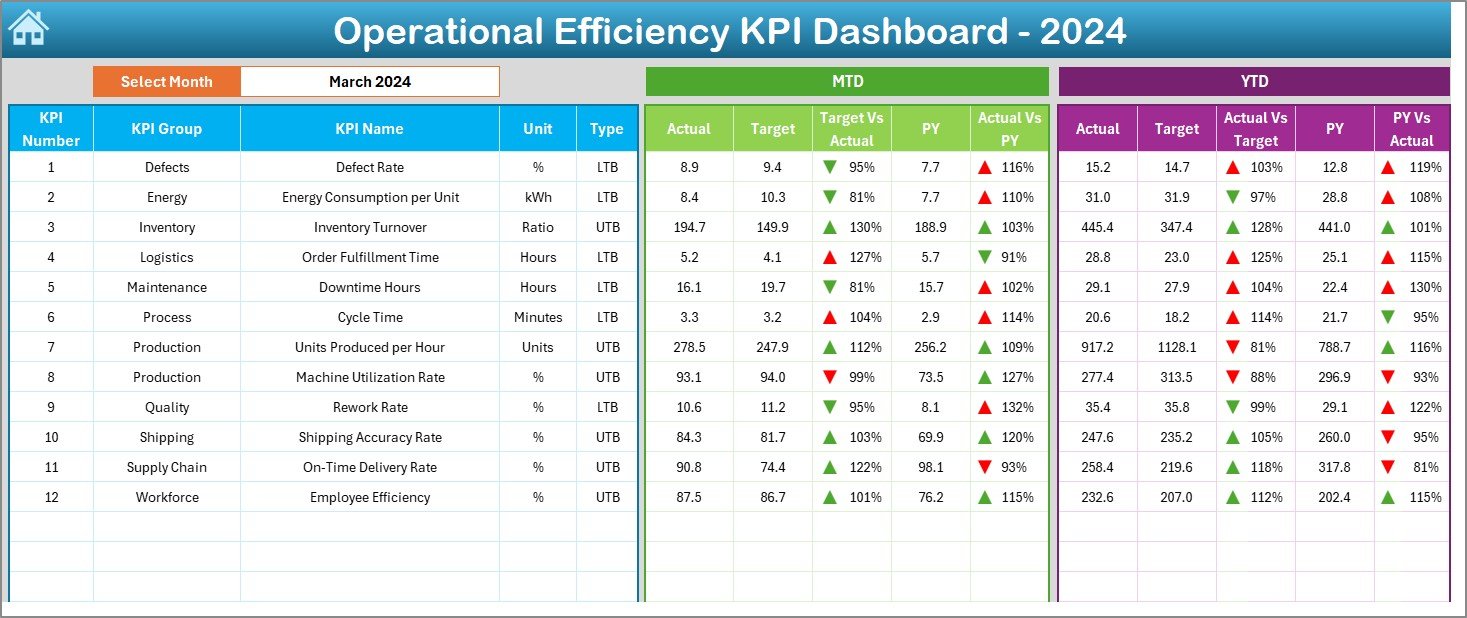
2. Dashboard Sheet Tab
This is the primary sheet that houses all your KPIs. Key features include:
-
MTD (Month-to-Date) and YTD (Year-to-Date) tracking for each KPI.
-
Target vs. Actual and Previous Year vs. Actual comparisons with conditional formatting (up/down arrows).
-
An intuitive dropdown menu in D3, allowing you to select the month and automatically adjust the data for that specific month.
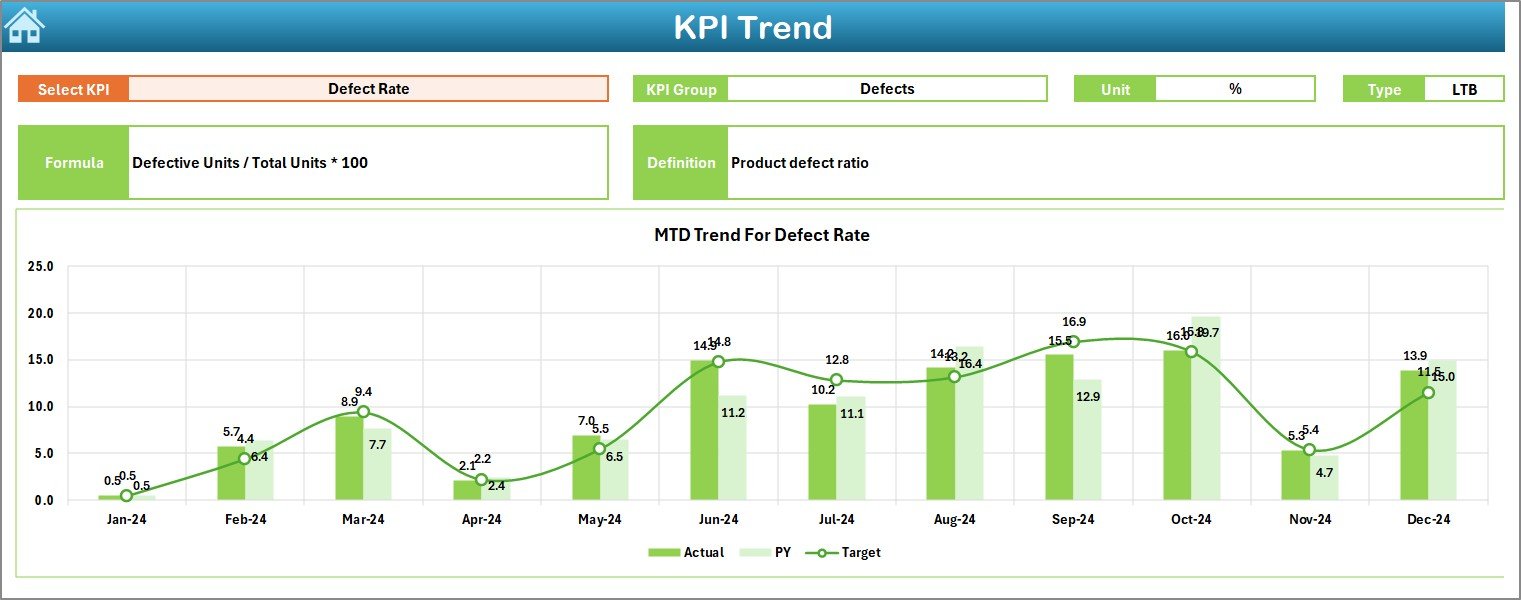
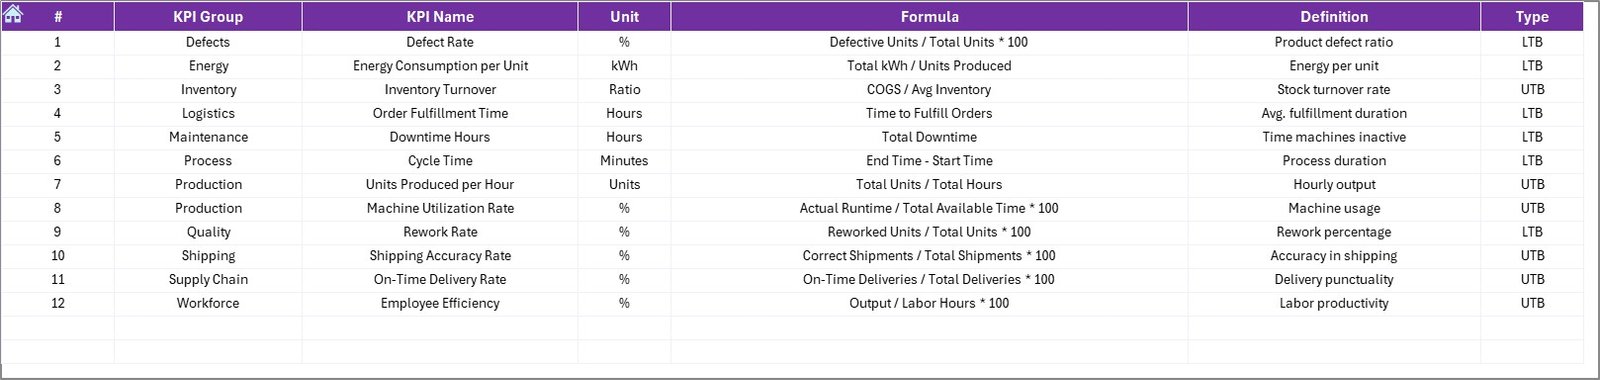
3. KPI Trend Sheet Tab
The KPI Trend tab offers insights into the evolution of various KPIs. Key components include:
-
KPI Group: Categorizes the KPI.
-
Unit of Measurement: Specifies the unit in which the KPI is measured.
-
KPI Type: Indicates whether the KPI is “Lower the Better” (LTB) or “Upper the Better” (UTB).
-
Formula and Definition: Displays the formula for calculating the KPI and its description.
Click to buy Operational Efficiency KPI Dashboard in Excel
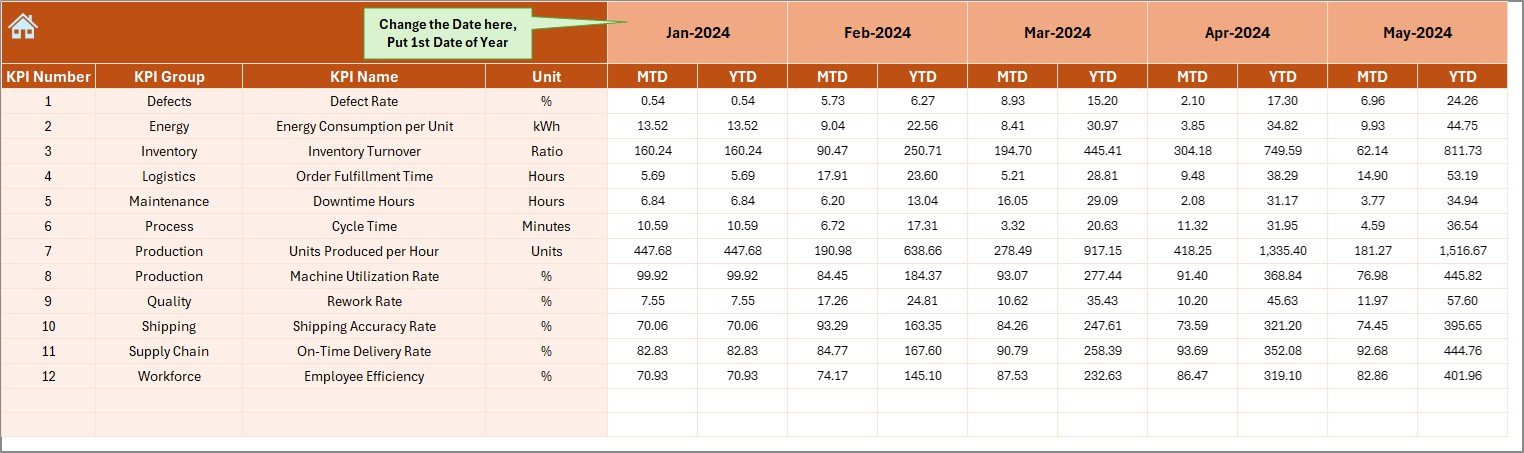
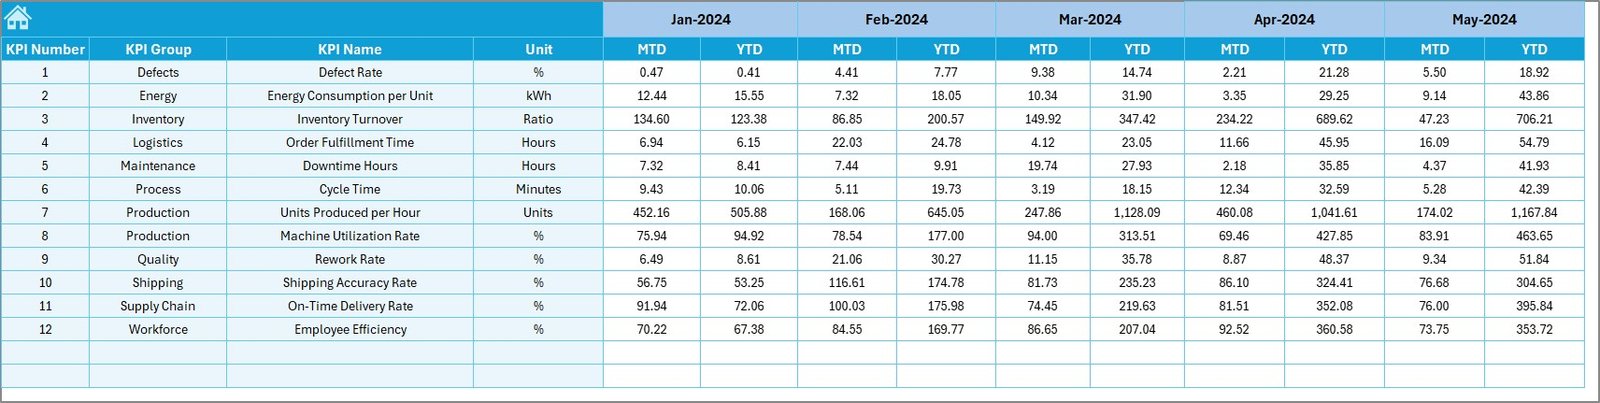
4. Actual Numbers Sheet Tab
In this sheet, you can input the actual values for each KPI on a monthly and year-to-date basis. Simply change the month in Range E1, and the entire dashboard will update accordingly.
5. Target Sheet Tab
Here, you can enter the target values for each KPI for a specific month. The sheet allows you to track both MTD and YTD targets, making it easier to compare the actual performance against the planned goals.
Click to buy Operational Efficiency KPI Dashboard in Excel
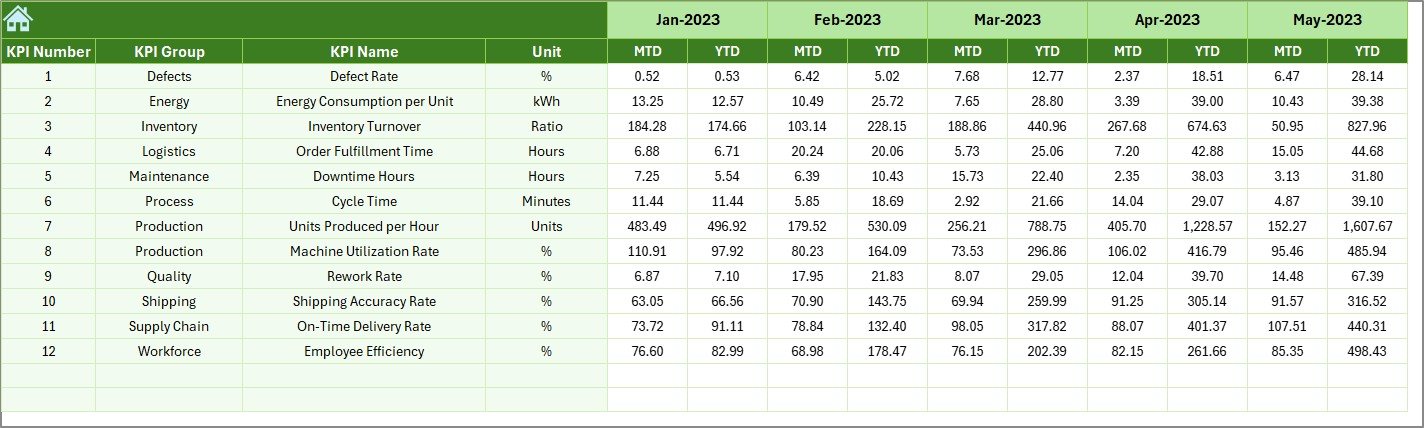
6. Previous Year Numbers Sheet Tab
In this tab, you input the previous year’s performance data for each KPI. This data is crucial for making year-over-year comparisons to track improvements or declines.
7. KPI Definition Sheet Tab
This sheet acts as a repository for all your KPIs. You can enter:
-
KPI Name
-
KPI Group
-
Unit
-
Formula
-
Definition
Click to buy Operational Efficiency KPI Dashboard in Excel
Advantages of Using the Operational Efficiency KPI Dashboard
Implementing an Operational Efficiency KPI Dashboard in Excel provides several key benefits that can significantly impact business operations:
- Improved Decision-Making: By tracking KPIs, decision-makers can gain valuable insights into business performance. The dashboard offers real-time data updates, making it easier to make data-driven decisions that improve operational efficiency.
- Clear Visibility into Performance: With visualizations like up/down arrows and year-to-year comparisons, stakeholders can easily assess performance at a glance, which aids in identifying areas that need improvement.
- Goal Setting and Monitoring: The ability to set targets for each KPI, alongside actual performance data, ensures that businesses stay focused on their goals. It also allows for more accurate performance evaluations.
- Customization: The dashboard is fully customizable, meaning you can tailor the KPIs to suit your specific operational needs. You can easily modify the template to fit any industry or business process.
- Time Efficiency: Excel provides a quick and efficient way to update and manage operational data. With the dashboard template, you can automate much of the work involved in tracking and reporting on KPIs.
Opportunities for Improvement in the Operational Efficiency KPI Dashboard
Click to buy Operational Efficiency KPI Dashboard in Excel
While the Operational Efficiency KPI Dashboard is an effective tool for many businesses, there are always opportunities for improvement. Here are some suggestions for enhancing this dashboard:
- Automating Data Entry: You can improve data entry processes by integrating Excel with other data management tools or using Power Query to automate the extraction of data from external sources.
- Integrating Power BI: By linking the Excel dashboard to Power BI, you can take advantage of more advanced data visualization features. This integration will allow for interactive reporting, which is especially helpful for teams that require more dynamic reporting capabilities.
- Adding More KPIs: Consider expanding the dashboard by adding more KPIs that align with your business’s specific operational goals. This might include employee productivity, inventory turnover, or customer satisfaction scores.
- Advanced Predictive Analytics: For forward-looking insights, integrate predictive analytics into the dashboard. This could include forecasting future KPI values based on past performance, helping businesses anticipate trends and adjust strategies.
- Mobile Optimization: Since businesses today require flexibility, consider optimizing the dashboard for mobile devices. By doing so, decision-makers can access the dashboard on the go and make real-time adjustments when necessary.
Best Practices for Using the Operational Efficiency KPI Dashboard
To make the most of your Operational Efficiency KPI Dashboard in Excel, follow these best practices:
- Regular Data Updates: Ensure that the dashboard is updated regularly to reflect the latest data. Set up a routine for entering actual numbers and comparing them against targets.
- Clear Definitions for Each KPI: Make sure each KPI is clearly defined and that everyone in the organization understands how to measure and interpret it. This will help prevent any confusion and ensure consistent data input.
- Focus on Actionable KPIs: Don’t overwhelm the dashboard with too many KPIs. Focus on the most actionable ones that directly impact operational efficiency and business performance.
- Set Realistic Targets: While it’s important to set ambitious targets, ensure they are achievable. Unrealistic targets can lead to frustration and demotivation among teams.
- Regular Review of KPIs: As business priorities change, periodically review and adjust the KPIs tracked on the dashboard. This will ensure that the dashboard remains aligned with the company’s strategic goals.
Frequently Asked Questions (FAQs)
Click to buy Operational Efficiency KPI Dashboard in Excel
1. What is an Operational Efficiency KPI Dashboard?
An Operational Efficiency KPI Dashboard in Excel is a tool used by businesses to track key performance indicators (KPIs) that measure the efficiency of their operations. It helps businesses monitor their performance, set goals, and make data-driven decisions.
2. How do I use the dashboard?
Simply input the actual data for each KPI in the respective tabs (such as Actual Numbers Sheet and Target Sheet). The dashboard will automatically update to display the most recent data and performance comparisons.
3. Can I customize the KPIs on the dashboard?
Yes, the dashboard is fully customizable. You can modify existing KPIs, add new ones, and tailor the definitions and formulas to fit your business’s specific needs.
4. How often should I update the dashboard?
It’s recommended to update the dashboard at least once a month. Regular updates will ensure that your business is staying on track with its operational goals and can respond to issues quickly.
5. Can I use this dashboard for industries other than operational efficiency?
Absolutely! While the template is designed for operational efficiency, it can be customized to track any type of business KPI. Whether you’re in HR, finance, or marketing, you can adjust the dashboard to suit your industry.
Conclusion
Click to buy Operational Efficiency KPI Dashboard in Excel
An Operational Efficiency KPI Dashboard in Excel is a powerful tool for businesses looking to optimize their operations and improve performance. By utilizing this template, you can gain real-time insights into your business’s efficiency, track progress over time, and make informed decisions that drive improvement.
Visit our YouTube channel to learn step-by-step video tutorials
Watch the step-by-step video Demo:
Click to buy Operational Efficiency KPI Dashboard in Excel


