Efficient water usage is essential for businesses, industries, and even households to reduce environmental impact, save costs, and meet regulatory standards. The Water Usage Efficiency KPI Dashboard in Excel is a powerful tool that allows organizations to monitor, measure, and optimize their water consumption. This dashboard enables users to visualize key performance indicators (KPIs), track trends, and make data-driven decisions to improve water efficiency. In this article, we will dive into the key features of the Water Usage Efficiency KPI Dashboard, its benefits, opportunities for improvement, and best practices for maximizing its effectiveness.
What is a Water Usage Efficiency KPI Dashboard?
A Water Usage Efficiency KPI Dashboard in Excel is a data visualization tool designed to help organizations track, analyze, and manage their water usage efficiently. By using KPIs, the dashboard allows businesses to monitor their water consumption patterns, compare actual performance to targets, and assess progress toward sustainability goals. It is a crucial tool for industries looking to improve their environmental footprint and optimize resource management.
Key Features of the Water Usage Efficiency KPI Dashboard
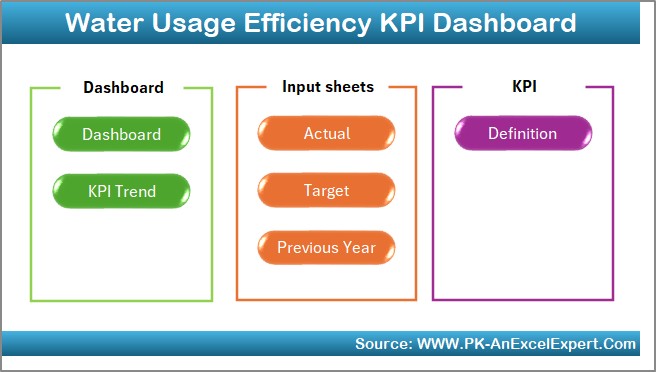
The Water Usage Efficiency KPI Dashboard in Excel consists of several key features designed to make water usage tracking simple, efficient, and insightful. The dashboard is divided into multiple worksheets, each serving a specific function:
1. Home Sheet Tab
The Home Sheet Tab serves as the entry point for the dashboard. Here, you can navigate to other tabs by clicking on designated buttons, providing a user-friendly interface for easy access to the rest of the dashboard.
Click to buy Water Usage Efficiency KPI Dashboard in Excel
2. Dashboard Sheet Tab
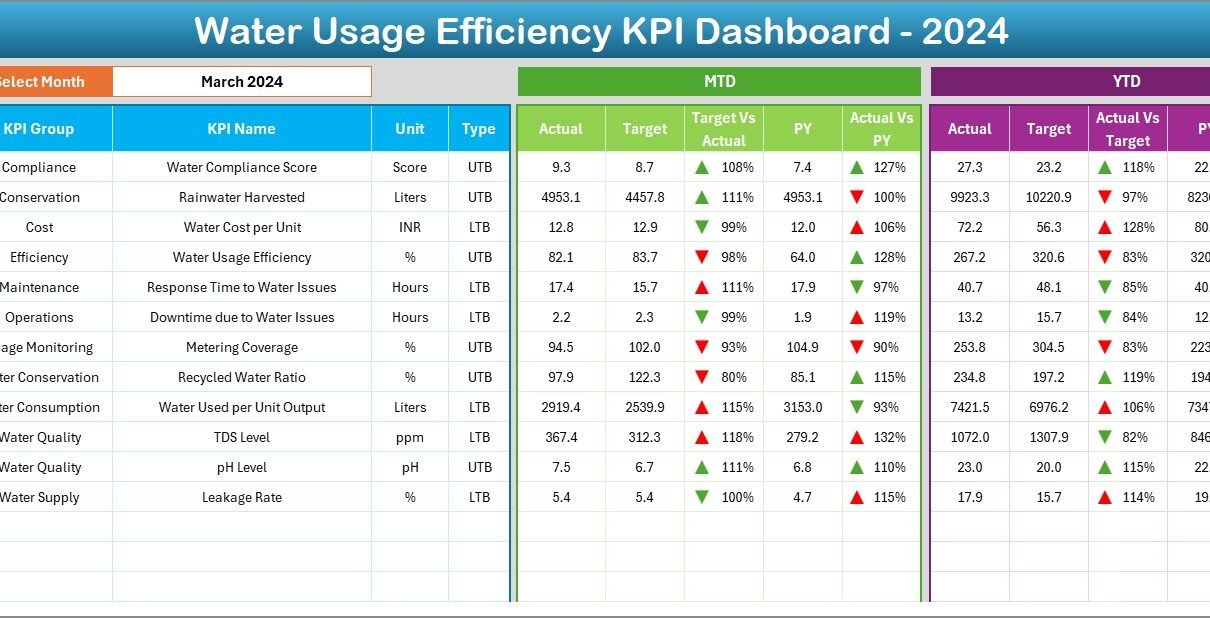
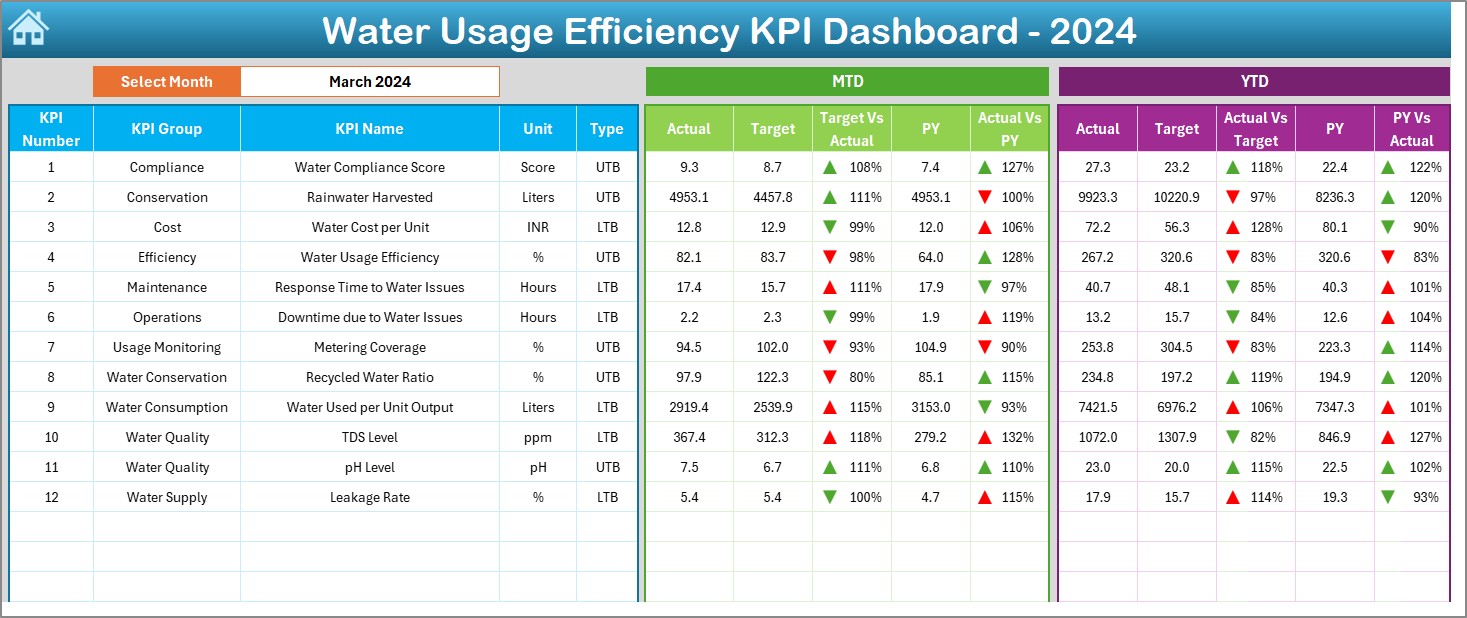
The Dashboard Sheet Tab is the main sheet where all the KPI data is visualized. In this sheet, you can view:
- MTD Actual: Displays the actual water usage for the current month.
- MTD Target: Shows the target water usage for the current month.
- Previous Year Data: Compares the current year’s performance against the previous year’s data.
- Target vs. Actual Comparison: Compares the target vs. actual water usage with conditional formatting to show performance trends (up and down arrows).
- YTD Actual: Displays the Year-to-Date actual water usage.
- YTD Target: Shows the target water usage for the year.
Click to buy Water Usage Efficiency KPI Dashboard in Excel
The dropdown in Range D3 allows you to select the month, and the numbers on the dashboard will automatically update to reflect that month’s data.
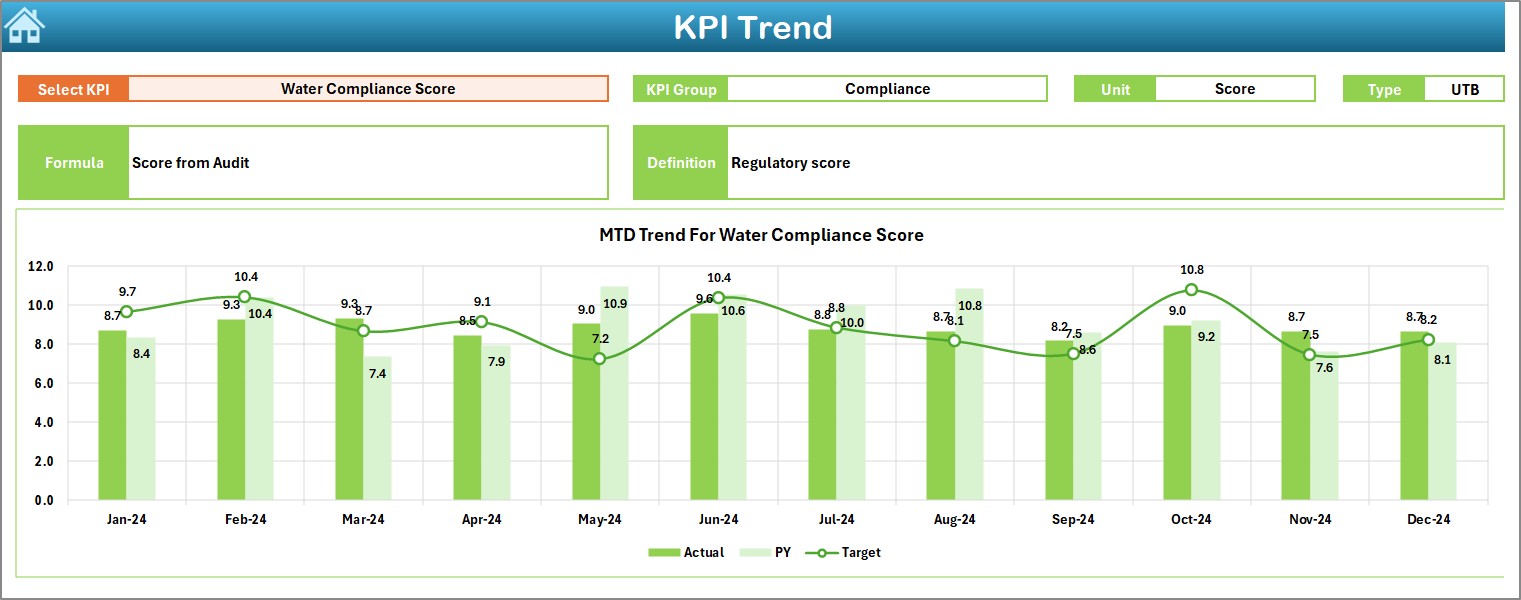
3. KPI Trend Sheet Tab
The KPI Trend Sheet Tab allows you to select a specific KPI from a dropdown list (in Range C3). It displays:
- KPI Group: The category to which the KPI belongs.
- Unit of Measurement: The unit used for each KPI (e.g., gallons, liters).
- KPI Type: Whether the KPI is “Lower the Better” or “Upper the Better.”
- Formula: The formula used to calculate the KPI.
- Definition: A description of what the KPI measures and its importance.
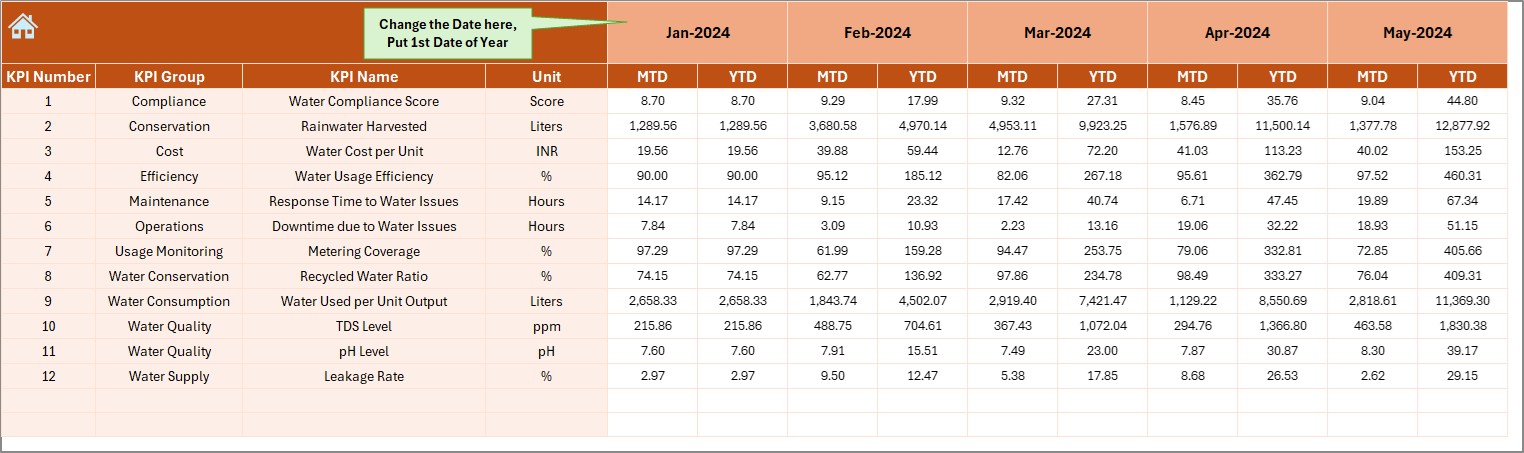
4. Actual Number Sheet Tab
The Actual Number Sheet Tab is where you input the actual data for YTD and MTD water usage. You can change the month in Range E1 to update the data accordingly.
Click to buy Water Usage Efficiency KPI Dashboard in Excel
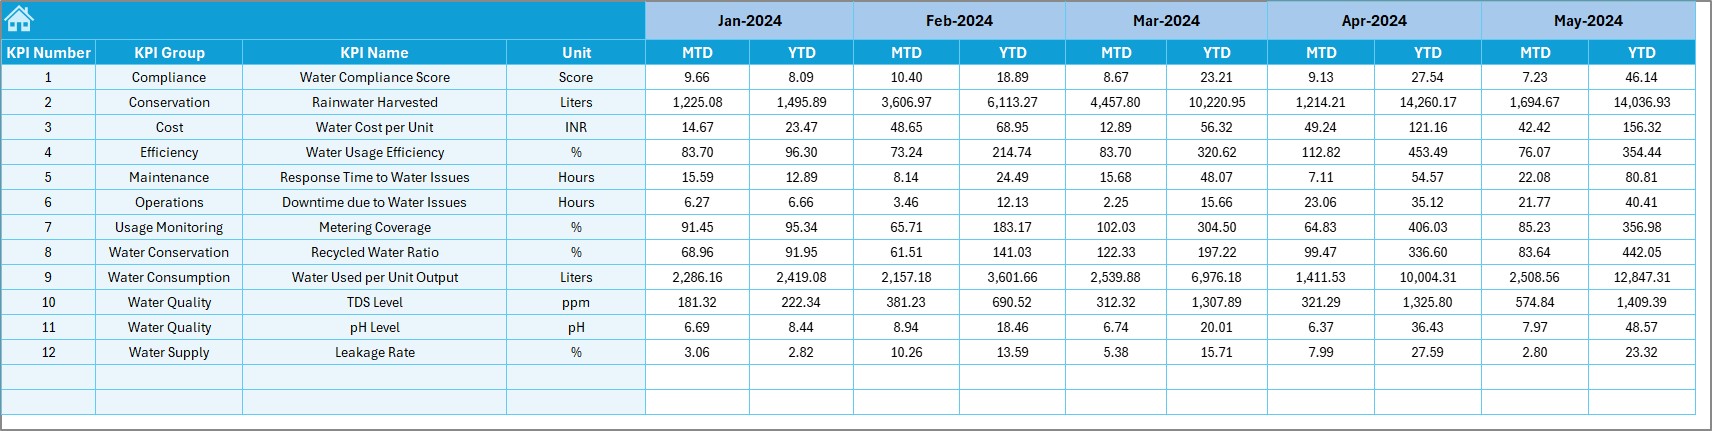
5. Target Sheet Tab
In this sheet, you can input the target numbers for each KPI for both MTD and YTD. This allows for a comparison between actual usage and target goals, providing insights into performance.
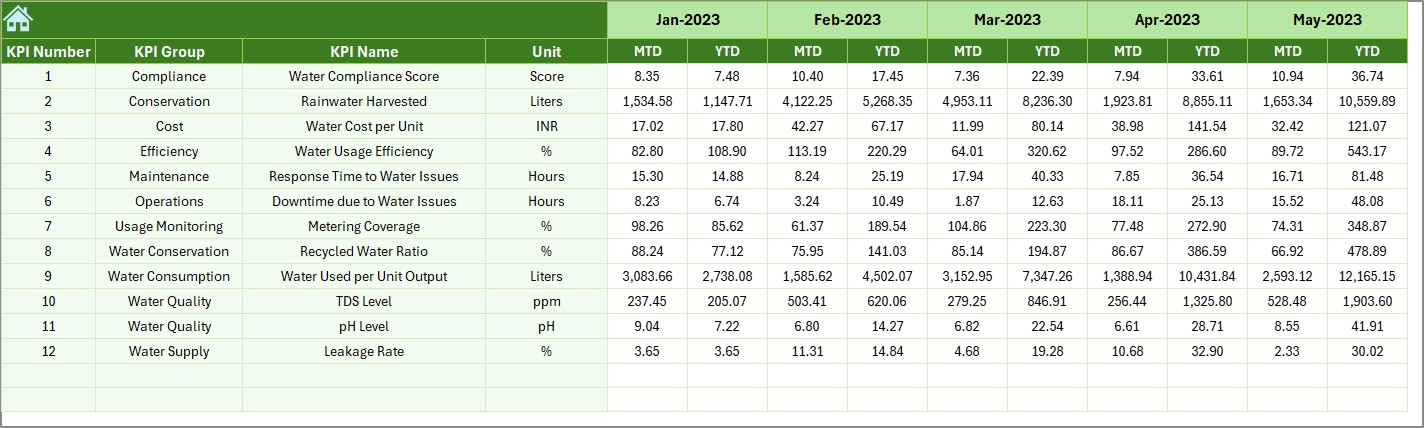
6. Previous Year Number Sheet Tab
This sheet is used to enter the previous year’s data for comparison. Enter the same numbers as you have for the current year, which will help in assessing improvements or areas needing attention.
Click to buy Water Usage Efficiency KPI Dashboard in Excel
7. KPI Definition Sheet Tab
The KPI Definition Sheet Tab provides the details of each KPI, including:
- KPI Name: The name of the KPI.
- KPI Group: The category under which the KPI falls.
- Unit: The measurement unit for the KPI.
- Formula: The formula used to calculate the KPI.
- Definition: A detailed explanation of the KPI and its significance in measuring water usage efficiency.

Advantages of Using a Water Usage Efficiency KPI Dashboard in Excel
Implementing a Water Usage Efficiency KPI Dashboard in Excel provides numerous advantages, both in terms of sustainability and business efficiency. Here are some key benefits:
- Real-Time Monitoring of Water Usage: With this dashboard, you can track your water usage in real-time, allowing you to make quick adjustments and prevent overuse. By visualizing actual vs. target data, you can identify discrepancies and address issues immediately.
- Data-Driven Decision Making: The dashboard presents data in a clear, understandable format, enabling managers to make informed decisions. Whether it’s adjusting operations, identifying water-saving opportunities, or reporting to stakeholders, the data visualization simplifies the decision-making process.
- Enhanced Accountability: By clearly defining KPIs and tracking performance, the dashboard helps ensure accountability at all levels. Whether it’s for individual departments or entire organizations, the dashboard makes it easy to track progress and assign responsibility.
- Sustainability and Cost Savings: Efficient water usage is key to reducing environmental impact and minimizing costs. This dashboard helps businesses track their progress toward sustainability goals, optimize water usage, and identify areas for cost savings through better resource management.
- Customizability: The Water Usage Efficiency KPI Dashboard in Excel is highly customizable. You can modify the KPIs, layout, and formulas to fit your specific needs, making it a versatile tool for various industries and organizations.
Opportunity for Improvement in a Water Usage Efficiency KPI Dashboard
Click to buy Water Usage Efficiency KPI Dashboard in Excel
While the Water Usage Efficiency KPI Dashboard is an effective tool for tracking and improving water usage, there are always opportunities for enhancement. Here are a few areas where improvements can be made:
- Automated Data Integration: Integrating the dashboard with external data sources (e.g., water meters, sensors, or billing systems) could automate the data input process, saving time and reducing the risk of errors.
- Predictive Analytics; By integrating advanced analytics, such as machine learning or forecasting algorithms, the dashboard could provide predictive insights into future water usage patterns, helping businesses proactively manage their consumption.
- Mobile Optimization: While the dashboard is accessible via desktop, optimizing it for mobile devices would make it more user-friendly, particularly for on-the-go monitoring. A mobile-friendly version could improve accessibility and usability for field teams.
- Integration with Other Environmental KPIs: To provide a more holistic view of environmental performance, integrating water usage data with other environmental KPIs (e.g., energy usage, waste generation) could offer a comprehensive sustainability dashboard.
Best Practices for Using a Water Usage Efficiency KPI Dashboard
To maximize the effectiveness of your Water Usage Efficiency KPI Dashboard in Excel, here are some best practices to follow:
- Set Clear and Realistic Targets: Make sure your water usage targets are achievable and aligned with your overall sustainability goals. Realistic targets will help keep the team motivated and focused on making improvements.
- Regularly Update Data: Consistent and accurate data entry is essential for the dashboard to provide meaningful insights. Update your actual water usage data regularly and compare it to the targets to track your progress.
- Review Trends and Patterns: Use the dashboard to analyze trends and patterns over time. Look for fluctuations in water usage, identify peak usage periods, and find opportunities for improvement. This can help you adjust operations to optimize water efficiency.
- Engage Stakeholders: Share the dashboard with relevant stakeholders, including department heads, sustainability teams, and senior management. This promotes transparency and encourages collaboration in reaching water efficiency goals.
- Take Action Based on Insights: The dashboard provides valuable insights, but the key to improving water usage efficiency is taking action. Use the data to make informed decisions, adjust operations, and implement water-saving strategies.
Frequently Asked Questions (FAQs)
Click to buy Water Usage Efficiency KPI Dashboard in Excel
1. What are KPIs for Water Usage Efficiency?
KPIs for water usage efficiency measure how effectively an organization uses water. Examples of water usage KPIs include gallons per unit of production, water waste reduction, and comparison of actual water usage to target levels.
2. How Do I Set Up a Water Usage Efficiency KPI Dashboard in Excel?
To set up a water usage efficiency KPI dashboard, create multiple sheets for actual data, targets, and comparisons. Use formulas to track progress, and add conditional formatting for visual indicators like up and down arrows to show performance.
3. How Can a Water Usage Efficiency KPI Dashboard Help Save Costs?
By tracking water usage and comparing it to targets, businesses can identify inefficiencies and take corrective actions to reduce consumption. This leads to cost savings and contributes to sustainability goals.
4. Can I Integrate the Dashboard with Other Systems?
Yes, you can integrate the dashboard with external systems like water meters or sensors for real-time data updates. This automation reduces manual input and provides more accurate data.
5. What Are the Benefits of Using Excel for This Dashboard?
Excel is highly customizable and provides powerful data analysis tools, making it ideal for creating a water usage efficiency KPI dashboard. It’s also accessible, easy to use, and can be shared across teams.
Conclusion
The Water Usage Efficiency KPI Dashboard in Excel is a powerful tool for monitoring and improving water usage. By providing real-time tracking, clear visualizations, and actionable insights, it helps businesses and organizations optimize water consumption, save costs, and meet sustainability goals. By following the best practices and utilizing the dashboard’s features, you can enhance your water management efforts and contribute to a more sustainable future.
Visit our YouTube channel to learn step-by-step video tutorials
Click to buy Water Usage Efficiency KPI Dashboard in Excel