As the global demand for sustainable energy solutions increases, businesses are increasingly turning to green energy to reduce their environmental impact. To track progress, measure success, and optimize energy-saving strategies, organizations must implement effective tools. One of the most valuable tools for businesses looking to improve their green energy performance is the Green Energy Adoption KPI Dashboard in Excel. This tool helps track energy usage, set goals, and analyze the efficiency of green energy strategies.
In this article, we’ll explore the key features of the Green Energy Adoption KPI Dashboard, the benefits it provides, how to improve it, and best practices to make the most of this dashboard. By the end of this guide, you’ll have a clear understanding of how to use this dashboard to optimize your green energy adoption efforts.
What is a Green Energy Adoption KPI Dashboard?
A Green Energy Adoption KPI Dashboard is a data tracking and visualization tool designed to help organizations monitor their green energy usage, efficiency, and sustainability goals. Using Key Performance Indicators (KPIs), the dashboard enables businesses to measure their energy consumption, compare it to target goals, and assess the impact of sustainability initiatives.
With the Green Energy Adoption KPI Dashboard in Excel, you can input actual usage data, compare it to predefined targets, and track your progress towards a more sustainable energy consumption model. Additionally, Excel’s robust functionalities allow for detailed analysis, making this dashboard an essential tool for businesses aiming to reduce their carbon footprint and energy costs.
Key Features of the Green Energy Adoption KPI Dashboard
The Green Energy Adoption KPI Dashboard in Excel is equipped with several essential features to help businesses track their green energy initiatives effectively. Below, we explain each of the seven worksheets included in the dashboard template:
1. Home Sheet Tab
The Home Sheet Tab acts as the central hub of the dashboard, allowing users to easily navigate between the other tabs. It contains links to the Dashboard, KPI Trend, and Actual Number sheets, making the dashboard user-friendly and accessible.

Click to buy Green Energy Adoption KPI Dashboard in Excel
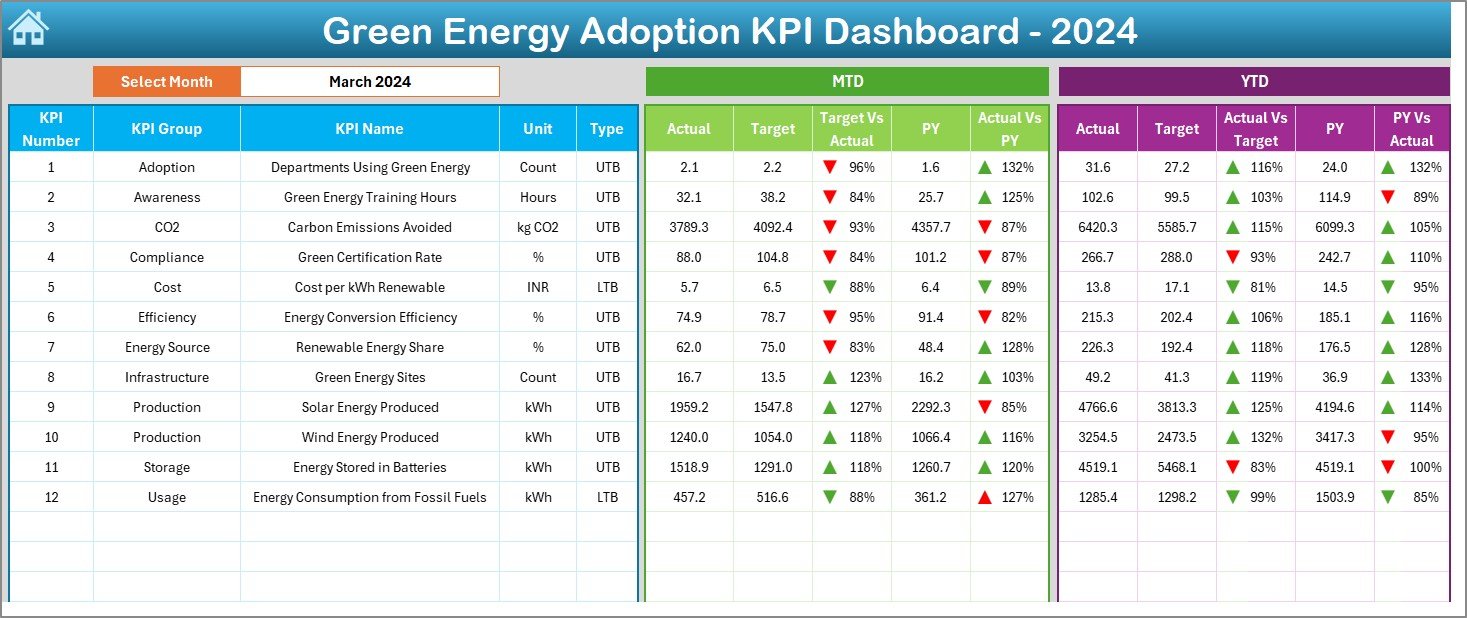
2. Dashboard Sheet Tab
The Dashboard Sheet Tab is the main interface of the dashboard where key KPIs are displayed and analyzed. Here, you can:
- MTD Actual: View the actual energy usage for the current month.
- MTD Target: See the target energy usage for the current month.
- Previous Year Data: Compare your current energy data with that of the previous year.
- Target vs. Actual Comparison: This feature compares actual performance to the target values, with conditional formatting (such as up and down arrows) to highlight performance.
- YTD Actual: Track energy usage for the entire year so far.
- YTD Target: See your year-to-date target energy usage.
Additionally, Range D3 allows you to select the month, and the dashboard will update automatically with data for that specific month.
Click to buy Green Energy Adoption KPI Dashboard in Excel
3. KPI Trend Sheet Tab
In the KPI Trend Sheet Tab, you can select any KPI from the dropdown list in Range C3. This tab displays:
- KPI Group: The category to which the KPI belongs (e.g., energy consumption, savings).
- Unit of Measurement: The unit used to track each KPI (e.g., kWh, dollars).
- KPI Type: Whether the KPI should be minimized or maximized (i.e., “Lower the Better” or “Upper the Better”).
- Formula: The formula used to calculate each KPI.
- Definition: A brief explanation of the KPI and its importance.

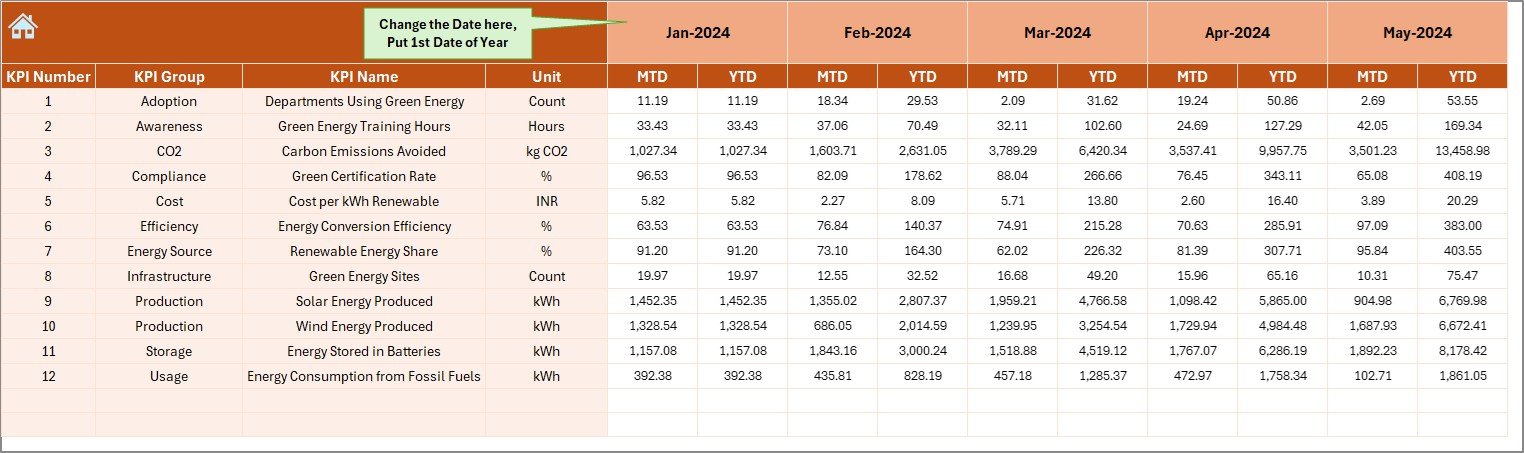
4. Actual Number Sheet Tab
The Actual Number Sheet Tab is where you enter the actual energy usage data for each month. The month is selected via Range E1, and the data for both MTD and YTD are updated automatically.
Click to buy Green Energy Adoption KPI Dashboard in Excel
5. Target Sheet Tab
In the Target Sheet Tab, you enter the target energy values for each KPI, both for MTD and YTD. These targets help you track how well you are meeting your sustainability goals and enable you to take corrective actions if necessary.

6. Previous Year Number Sheet Tab
This tab allows you to input data from the previous year, which is critical for comparison. By comparing this data with current figures, you can evaluate whether your green energy adoption efforts are making a positive impact.

Click to buy Green Energy Adoption KPI Dashboard in Excel
7. KPI Definition Sheet Tab
The KPI Definition Sheet Tab provides detailed information on each KPI. It includes:
- KPI Name: The name of the KPI.
- KPI Group: The group the KPI belongs to (e.g., energy savings, renewable energy).
- Unit: The unit of measurement used for the KPI.
- Formula: The formula used to calculate the KPI.
- Definition: An explanation of what the KPI measures and how it is used to evaluate energy usage efficiency.

Advantages of Using a Green Energy Adoption KPI Dashboard in Excel
There are several significant advantages to using the Green Energy Adoption KPI Dashboard in Excel. Here are a few key benefits:
- Efficient Monitoring of Energy Usage: The dashboard allows you to monitor your energy usage on a monthly and yearly basis, providing valuable insights into how well your organization is adopting green energy solutions. Real-time tracking enables you to take immediate corrective actions when needed.
- Better Decision Making: With clear visualizations and KPIs, decision-makers can quickly assess whether current green energy initiatives are working. The dashboard simplifies complex data and enables organizations to make informed, data-driven decisions to improve energy efficiency.
- Enhanced Sustainability Reporting: Many organizations are now required to report on their sustainability efforts. This dashboard helps by providing accurate, real-time data that can be used for internal or external reporting, ensuring that your organization’s energy consumption is aligned with environmental goals.
- Customization: Excel’s flexibility allows you to fully customize the dashboard to fit your organization’s specific needs. You can modify the KPIs, formulas, units of measurement, and layout, ensuring that the dashboard serves as a tailored solution for monitoring your green energy efforts.
- Cost Savings: By tracking green energy usage against targets and analyzing performance, businesses can identify areas of waste and inefficiency. This helps save costs by ensuring that energy is used more efficiently and that energy-saving strategies are optimized.
Opportunities for Improvement in a Green Energy Adoption KPI Dashboard
Click to buy Green Energy Adoption KPI Dashboard in Excel
While the Green Energy Adoption KPI Dashboard offers many benefits, there are opportunities to enhance its functionality further. Here are a few ways the dashboard can be improved:
- Automation of Data Collection; By integrating the dashboard with energy management systems (EMS) or real-time data sources, the data input process can be automated. This reduces the need for manual data entry and ensures that the data is always accurate and up-to-date.
- Predictive Analytics; Adding predictive analytics features can help forecast future energy usage based on historical trends. This would enable businesses to anticipate energy needs and proactively adjust their consumption strategies.
- Integration with Other KPIs: To create a more holistic view of sustainability, the dashboard could integrate with other environmental KPIs, such as waste reduction or carbon footprint. This would allow for a more comprehensive analysis of the organization’s overall environmental impact.
- Mobile Optimization: Making the dashboard mobile-friendly would allow users to monitor and update their green energy data on the go. This feature is particularly useful for field teams or businesses with remote workers.
Best Practices for Using a Green Energy Adoption KPI Dashboard
To maximize the effectiveness of your Green Energy Adoption KPI Dashboard in Excel, follow these best practices:
- Set Clear and Achievable Energy Targets: Before using the dashboard, set clear, realistic targets for your green energy adoption efforts. Targets should be specific, measurable, attainable, relevant, and time-bound (SMART). Clear goals will make it easier to track progress and stay motivated.
- Update Data Regularly: Ensure that the data is regularly updated to keep the dashboard accurate and reliable. Whether you’re tracking monthly energy usage or annual data, updating the dashboard frequently will provide timely insights into your progress.
- Analyze Trends and Identify Patterns: Use the KPI Trend Sheet Tab to track energy usage over time. Identifying trends will help you understand seasonal variations, inefficiencies, and opportunities for improvement. This analysis is key to optimizing green energy initiatives.
- Engage Stakeholders: Share the dashboard with key stakeholders, including management, sustainability teams, and other relevant departments. Transparency promotes accountability and helps ensure that everyone is aligned with the organization’s green energy goals.
- Take Action Based on Insights: data provided by the dashboard is only valuable if you act on it. Use the insights to adjust operations, optimize energy consumption, and improve sustainability strategies. The dashboard serves as a guide for making informed decisions that benefit both the environment and your organization.
Frequently Asked Questions (FAQs)
Click to buy Green Energy Adoption KPI Dashboard in Excel
1. What are the KPIs for Green Energy Adoption?
KPIs for green energy adoption measure various aspects of energy efficiency, such as energy consumption, cost savings, renewable energy percentage, and carbon footprint reduction. Common KPIs include energy intensity (energy per unit of output), renewable energy percentage, and energy cost savings.
2. How Do I Set Up a Green Energy Adoption KPI Dashboard in Excel?
Setting up the dashboard involves creating multiple sheets to track data for actual energy usage, target energy usage, and performance comparisons. You’ll need to enter formulas to calculate KPIs and use Excel’s visualization tools to display data effectively.
3. How Can a Green Energy Adoption KPI Dashboard Help Save Costs?
By comparing actual energy usage with targets, businesses can identify areas of inefficiency. This allows them to take corrective actions, such as adjusting operational processes or implementing energy-saving strategies, which leads to cost savings.
4. Can the Dashboard Be Integrated with Other Systems?
Yes, the dashboard can be integrated with energy management systems (EMS) or real-time data sources to automate data collection. This integration reduces manual entry and ensures the dashboard is always updated with the latest information.
5. What Are the Benefits of Using Excel for This Dashboard?
Excel offers flexibility and powerful data analysis tools, making it an ideal platform for building a Green Energy Adoption KPI Dashboard. It’s easy to customize, allows for real-time tracking, and can be shared across teams, making it a cost-effective solution for monitoring sustainability goals.
Conclusion
The Green Energy Adoption KPI Dashboard in Excel is an essential tool for businesses aiming to optimize their green energy adoption efforts. By providing real-time tracking, clear visualizations, and actionable insights, this dashboard helps organizations monitor energy usage, achieve sustainability goals, and reduce costs. Excel’s customizability and powerful features make it an ideal platform for creating a tailored solution to track and improve green energy adoption.
Visit our YouTube channel to learn step-by-step video tutorials
Click to buy Green Energy Adoption KPI Dashboard in Excel