Managing finance and accounting processes is no easy task, especially when accuracy, timeliness, and compliance are at stake. That’s why a Finance and Accounting Process Improvement KPI Dashboard in Excel can completely transform your workflow. This all-in-one dashboard helps you monitor, analyze, and optimize your finance operations without needing expensive software or complicated tools.
In this detailed article, we’ll break down what this dashboard is, how it works, and why every finance team should be using one.
Click to Purchases Finance and Accounting Process Improvement KPI Dashboard in Excel
What is a Finance and Accounting Process Improvement KPI Dashboard?
A Finance and Accounting Process Improvement KPI Dashboard is an Excel-based tool that tracks key performance indicators (KPIs) related to financial accuracy, efficiency, compliance, and performance. It provides real-time updates on MTD (Month-To-Date) and YTD (Year-To-Date) metrics, enabling managers to identify areas of improvement and make data-driven decisions.
This dashboard doesn’t just show you numbers—it gives you actionable insights.
Why You Need a KPI Dashboard in Finance
If you’re still using scattered spreadsheets or manual reporting methods, you’re probably spending too much time chasing numbers. Here’s why a KPI dashboard is a game-changer:
✅ Centralized Data: All performance metrics in one place
✅ Time-Saving: Automated monthly and yearly calculations
✅ Improved Decision-Making: Visual charts and conditional formatting highlight trends
✅ Customizable: Adapt it to your specific KPIs and targets
What’s Included in the Dashboard?
This Excel template comes with seven carefully designed worksheets, each serving a specific function to streamline your workflow:
Home Sheet

A simple and user-friendly index page with six clickable buttons that take you to different sections of the workbook. It acts as the control panel.
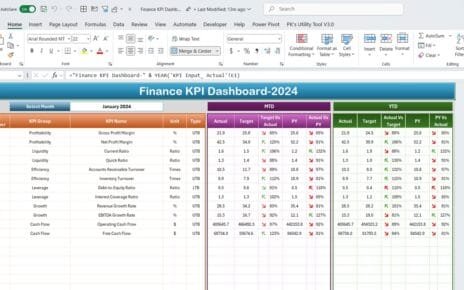
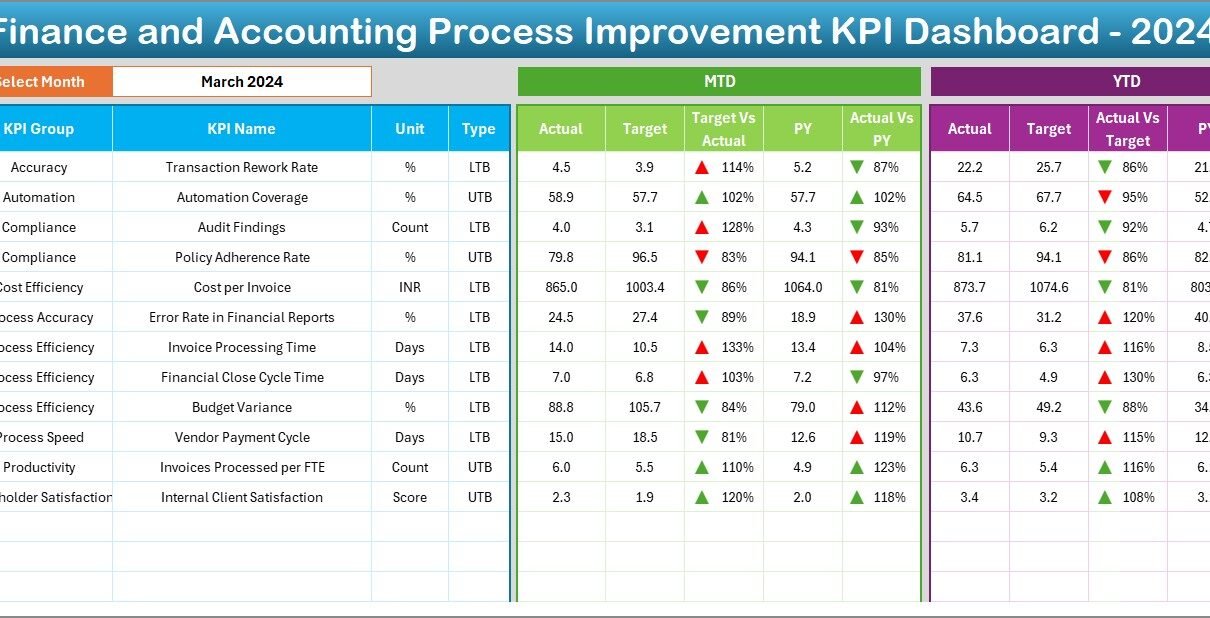
Dashboard Sheet Tab
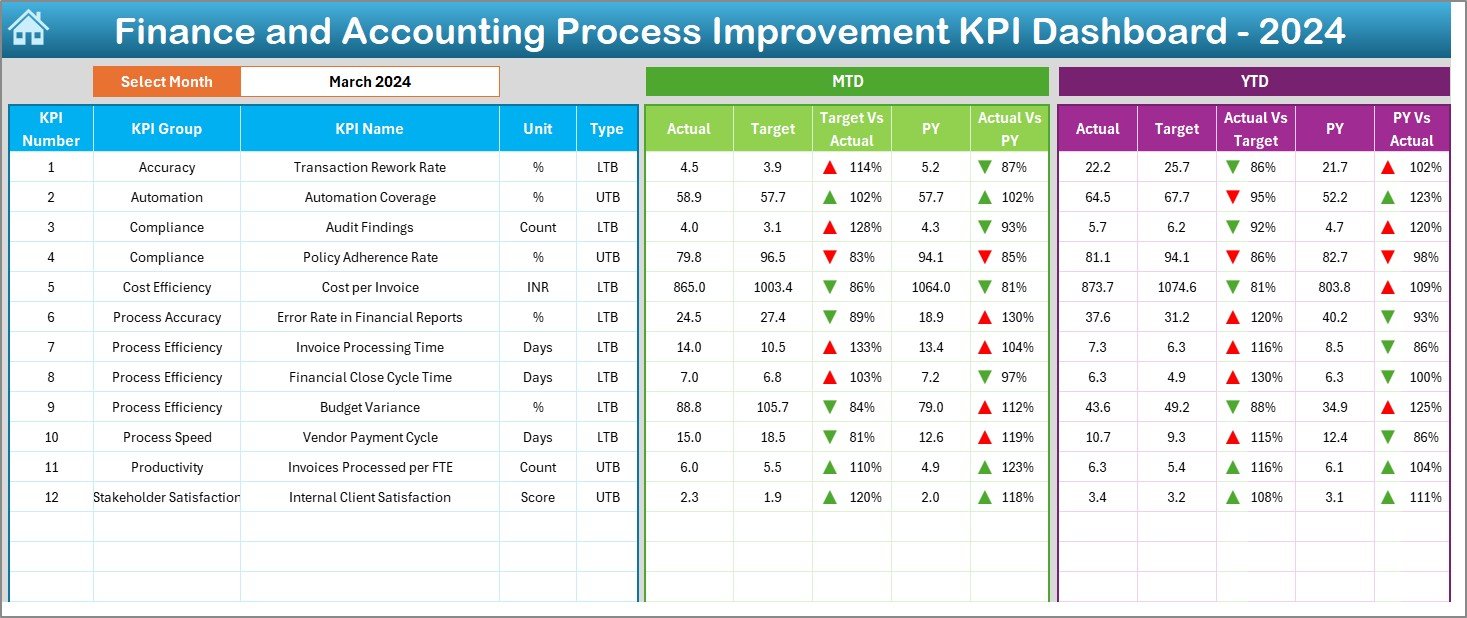
This is where the magic happens.
- Select your desired month from cell D3.
- View MTD and YTD values for Actuals, Targets, and Previous Year (PY).
- Instantly compare these with visual arrows indicating performance.
- Conditional formatting highlights improvements or declines.
KPI Trend Sheet Tab

Dive deeper into performance trends:
- Choose a KPI from cell C3.
- Get detailed metrics: KPI Group, Unit, Type (UTB or LTB), Formula, and Definition.
- View trend charts for MTD and YTD against Target and PY.
Actual Numbers Input Sheet

- Simply update the monthly actual figures.
- Change the base month using cell E1 to adjust the reporting period.
- Supports both MTD and YTD inputs.
Target Sheet Tab

- Input monthly targets for each KPI.
- Allows you to manage expectations and performance goals.
Previous Year Numbers Sheet Tab

- Record historical data from the previous year.
- Helps in year-over-year analysis.
KPI Definition Sheet Tab
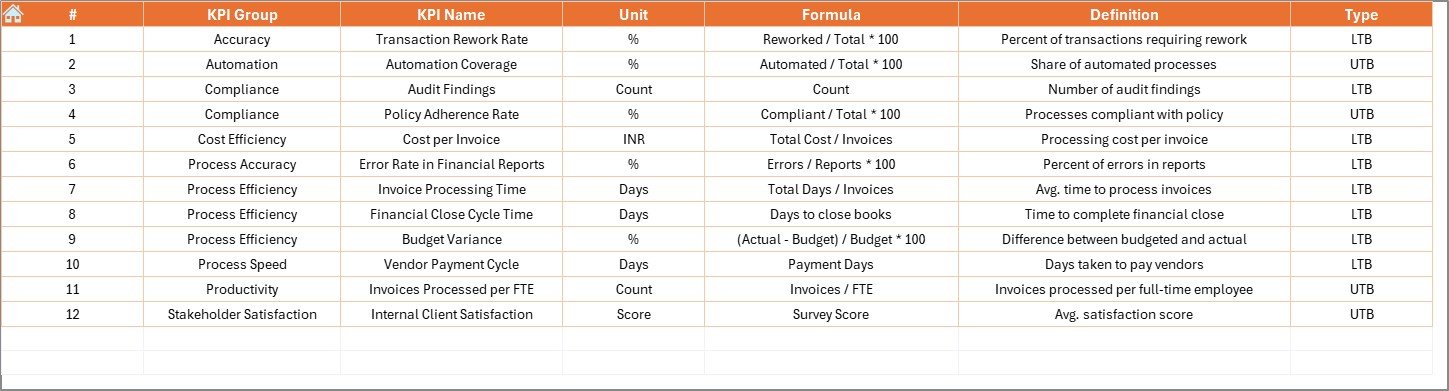
- Store all essential KPI metadata.
- Includes KPI Name, Group, Unit, Formula, and a brief definition.
Advantages of Using This KPI Dashboard
This dashboard isn’t just a tracking tool—it’s a productivity booster.
🔢 Improved Accuracy
All formulas are pre-embedded and auto-calculated, reducing manual errors.
📊 Better Visualization
With color-coded arrows and interactive charts, understanding data becomes simple.
🚀 Fast Decision-Making
Quickly identify underperforming areas or positive trends.
⚖️ Enhanced Comparisons
Track performance not just against targets, but also against the previous year’s performance.
🤝 Collaboration Made Easy
Team members can update actual and target data without affecting the dashboard’s logic.
Best Practices for Using the KPI Dashboard
To get the most out of your dashboard, follow these best practices:
- Set Realistic Targets
Avoid overly ambitious goals. Base your targets on past performance and industry benchmarks.
- Keep It Updated
Update actual and target sheets every month to maintain data accuracy.
- Use Data Validation
Implement dropdowns and restricted input ranges to prevent entry errors.
- Protect Sheets
Lock the formula cells and dashboard visuals to prevent accidental changes.
- Review Trends Monthly
Don’t just look at numbers—analyze them. Use trend sheets to assess ongoing progress.
- Train Your Team
Ensure that everyone understands how to use the dashboard and update it properly.
Common Finance KPIs You Can Track
Click to Purchases Finance and Accounting Process Improvement KPI Dashboard in Excel
Not sure what KPIs to include? Here are some popular and useful metrics:
- Days Sales Outstanding (DSO)
- Accounts Payable Turnover
- Budget Variance
- Invoice Processing Time
- Revenue per Employee
- Operating Expense Ratio
- Cost per Invoice
Each of these indicators can reveal insights into process bottlenecks and cost efficiency.
How This Dashboard Improves Financial Processes
Let’s take a closer look at how this Excel tool transforms your operations:
✏️ Streamlines Reporting
No more compiling numbers from different files. The dashboard consolidates all inputs and automates outputs.
📅 Encourages Routine Analysis
You’ll want to check the dashboard frequently to see how your finance operations are performing.
🤝 Promotes Accountability
Each KPI has a clear definition and ownership, making it easy to assign responsibility.
🏛 Enables Strategic Planning
With historical comparisons and YTD data, you can make long-term decisions confidently.
📅 When to Use This KPI Dashboard?
You can use this dashboard in many scenarios:
- During month-end or year-end closing
- For quarterly board reviews
- In budgeting and forecasting meetings
- While conducting internal audits
- For financial performance reviews with stakeholders
📅 Who Can Use This Dashboard?
This dashboard isn’t just for accountants! It’s useful for:
- Finance Managers
- CFOs
- Audit Teams
- Budget Analysts
- Financial Consultants
- Small Business Owners
Conclusion: Make Smarter Decisions with Data
The Finance and Accounting Process Improvement KPI Dashboard in Excel gives you all the tools you need to monitor, evaluate, and enhance your financial workflows. With easy navigation, built-in formulas, and visual aids, this dashboard simplifies complex finance tracking tasks. Whether you run a small business or manage a corporate finance team, this tool will help you take control of your data and drive results.
Start using this template today and experience the transformation yourself.
Frequently Asked Questions (FAQs)
🔄 What is a Finance and Accounting Process Improvement KPI Dashboard?
A Finance and Accounting Process Improvement KPI Dashboard is an Excel-based tool that tracks key performance indicators (KPIs) related to financial accuracy, efficiency, compliance, and performance. It provides real-time updates on MTD (Month-To-Date) and YTD (Year-To-Date) metrics, enabling managers to identify areas of improvement and make data-driven decisions.
This dashboard doesn’t just show you numbers—it gives you actionable insights.
📈 Why You Need a KPI Dashboard in Finance
If you’re still using scattered spreadsheets or manual reporting methods, you’re probably spending too much time chasing numbers. Here’s why a KPI dashboard is a game-changer:
- ✅ Centralized Data: All performance metrics in one place
- ✅ Time-Saving: Automated monthly and yearly calculations
- ✅ Improved Decision-Making: Visual charts and conditional formatting highlight trends
- ✅ Customizable: Adapt it to your specific KPIs and targets
🤔 Frequently Asked Questions (FAQs)
- Can I customize the KPIs in the dashboard?
Yes, the dashboard is fully customizable. You can add, remove, or modify KPIs in the definition sheet.
- Do I need advanced Excel skills to use it?
Not at all! Basic Excel knowledge is enough. The dashboard is user-friendly with drop-downs and pre-set formulas.
- Is this dashboard suitable for startups?
Absolutely. It helps small teams stay on top of their financial metrics without expensive software.
- Can multiple users update the dashboard?
Yes, as long as users don’t change formulas or visuals, multiple team members can collaborate easily.
- How often should I update the data?
Monthly updates are recommended to maintain accuracy and see performance trends.
s, the dashboard is fully customizable. You can add, remove, or modify KPIs in the definition sheet.
- Do I need advanced Excel skills to use it?
Not at all! Basic Excel knowledge is enough. The dashboard is user-friendly with drop-downs and pre-set formulas.
- Is this dashboard suitable for startups?
Absolutely. It helps small teams stay on top of their financial metrics without expensive software.
- Can multiple users update the dashboard?
Yes, as long as users don’t change formulas or visuals, multiple team members can collaborate easily.
- How often should I update the data?
Monthly updates are recommended to maintain accuracy and see performance trends.
Click to Purchases Finance and Accounting Process Improvement KPI Dashboard in Excel
Visit our YouTube channel to learn step-by-step video tutorials