In the world of data-driven decision-making, A/B testing plays a crucial role in optimizing performance and improving outcomes. However, managing and analyzing A/B test results can be challenging without a structured approach. This is where an A/B Testing KPI Dashboard in Excel comes into play.
With this dashboard, you can efficiently track, compare, and visualize key performance indicators (KPIs) related to your A/B tests. Whether you’re testing different marketing strategies, website layouts, or product variations, this ready-to-use Excel template simplifies data management and interpretation.
This article will walk you through the features, advantages, best practices, and frequently asked questions about the A/B Testing KPI Dashboard in Excel.
Click to A/B Testing KPI
Key Features of A/B Testing KPI Dashboard
Our A/B Testing KPI Dashboard consists of seven powerful worksheets designed to provide in-depth insights into test performance:
Home Sheet
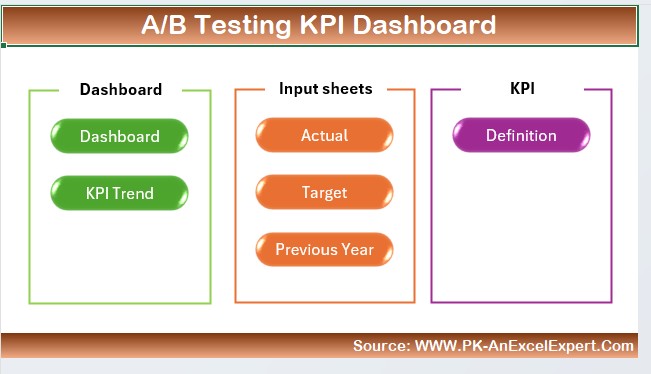
- This serves as an index sheet, providing quick navigation to different sections of the dashboard. It includes six clickable buttons, allowing users to jump to the respective worksheet easily.
Click to A/B Testing KPI
Dashboard Sheet Tab
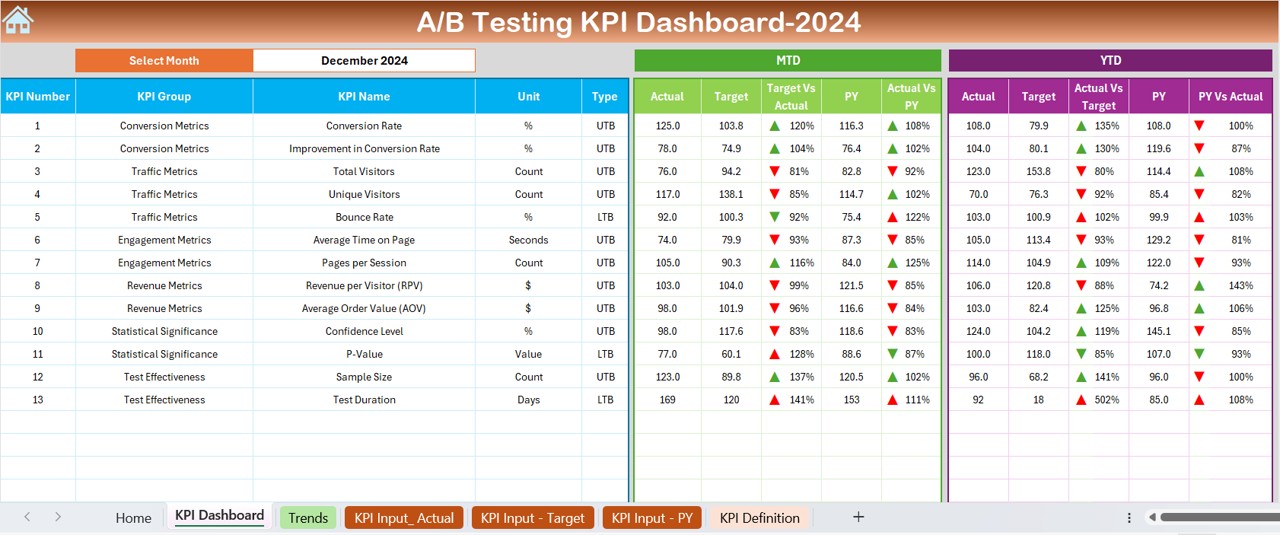
The Dashboard Sheet is the heart of the template, showcasing a comprehensive summary of all key metrics. Here’s what it includes:
- A month selection drop-down (Cell D3) – Select the desired month to update all KPI values dynamically.
- MTD (Month-to-Date) Actual vs. Target vs. Previous Year:
- Displays actual numbers for the selected month.
- Compares with the target and previous year’s performance.
- Uses conditional formatting with up/down arrows to highlight performance trends.
- YTD (Year-to-Date) Actual vs. Target vs. Previous Year:
- Provides cumulative data for the year.
- Helps identify long-term trends and performance gaps.
KPI Trend Sheet Tab
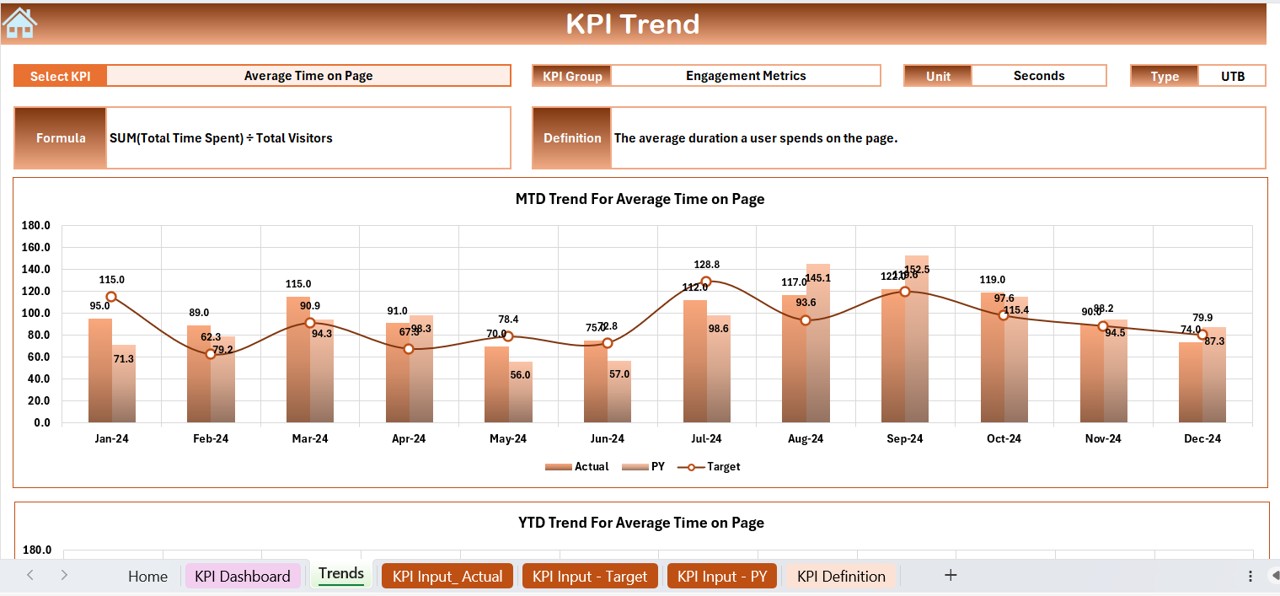
- This sheet provides an in-depth analysis of individual KPIs:
- KPI selection drop-down (Cell C3) to choose any KPI.
Displays:
- KPI Group
- Unit of KPI (Percentage, Count, Ratio, etc.)
- Type of KPI (Lower is better or Higher is better)
- Formula and Definition
- MTD and YTD Trend Charts – Graphical representation of performance over time.
Click to A/B Testing KPI
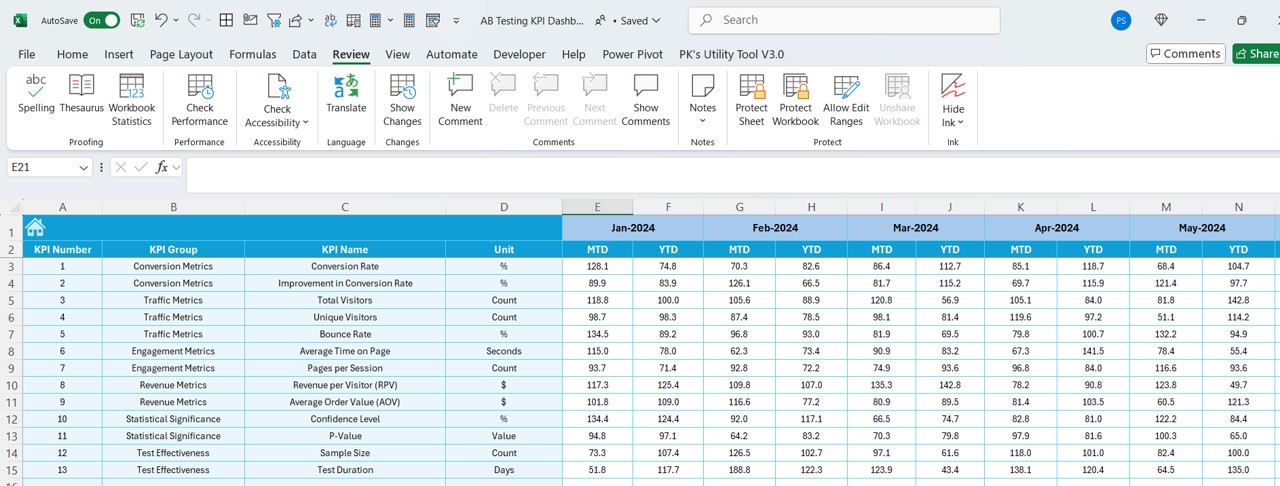
Actual Numbers Input Sheet
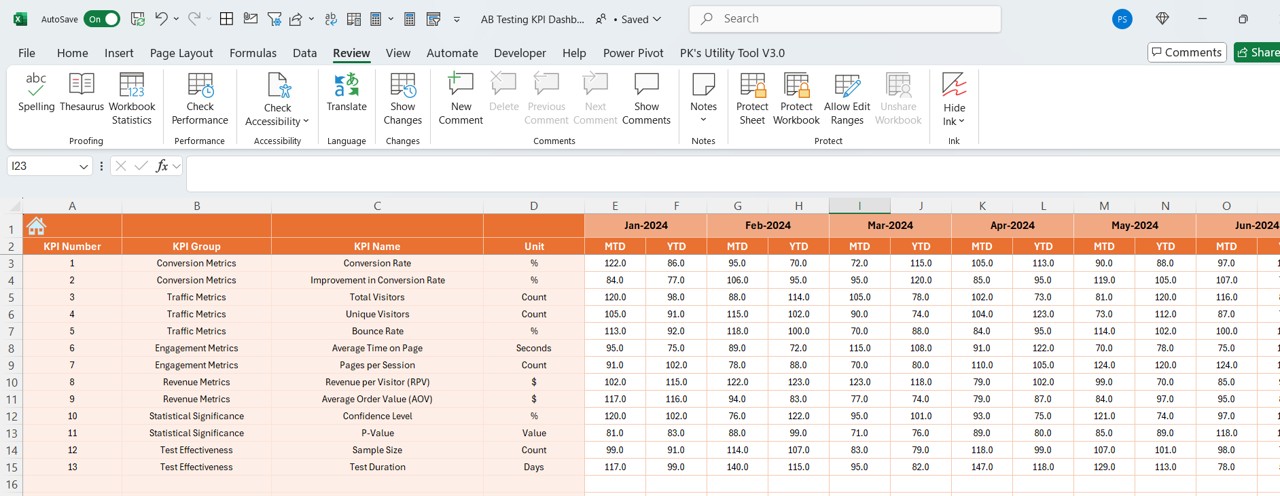
- Users enter actual performance numbers for MTD and YTD.
- Dynamic month selection (Cell E1) – Adjust the dashboard to track any month’s data.
Target Sheet Tab
- Users input monthly target values for each KPI.
- Ensures clear benchmarks for evaluating test success.
Previous Year Numbers Sheet Tab
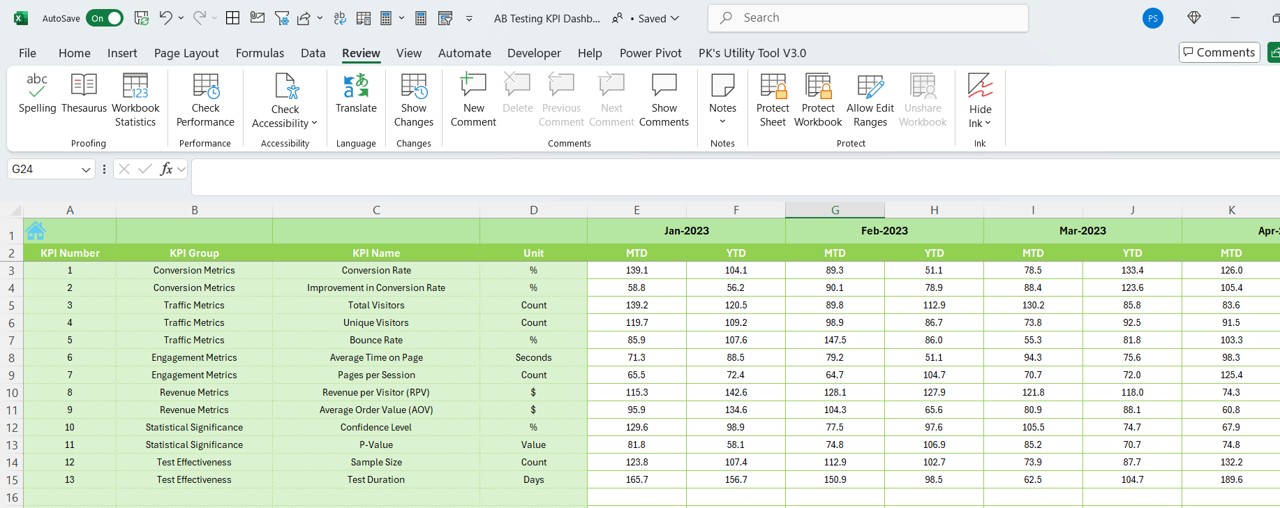
- Historical data entry section.
- Facilitates year-over-year comparison for strategic decision-making.
KPI Definition Sheet Tab
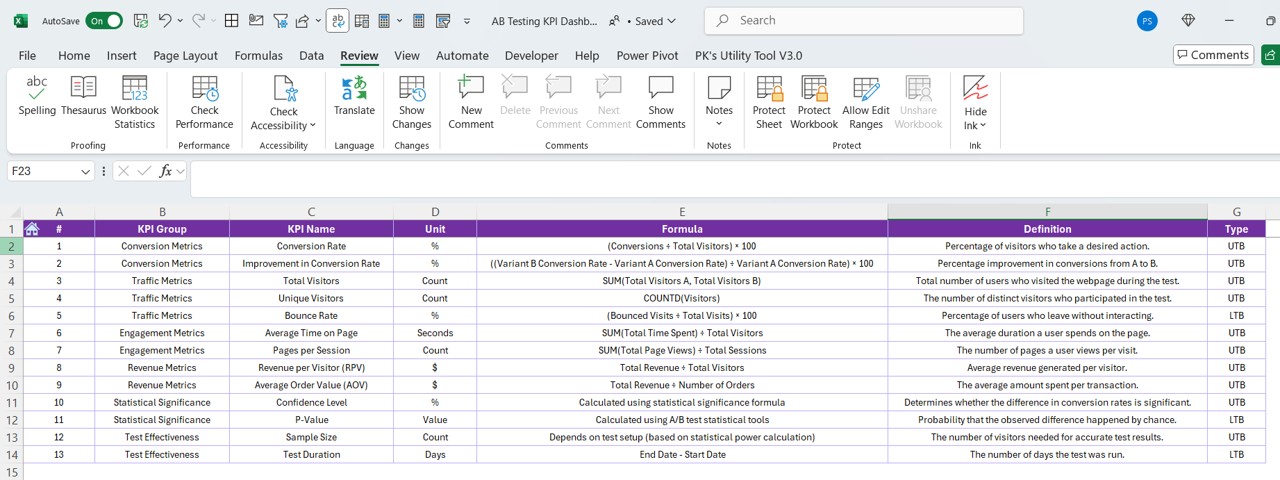
Maintains a structured database of all KPIs.
Includes:
- KPI Name
- KPI Group
- Measurement Unit
- Formula
- Definition
Advantages of Using the A/B Testing KPI Dashboard in Excel
- Data-Driven Decision Making: With real-time KPI tracking, you can quickly identify winning variations and make data-backed decisions.
- Visual Performance Comparison: The dashboard and trend charts provide an easy-to-understand visual representation of MTD and YTD performance.
- Saves Time and Effort: Instead of manually compiling A/B test data, this dashboard automates data consolidation and visualization.
- Customizable & Scalable: Easily modify KPI formulas, add new test metrics, and expand the dashboard based on your testing needs.
- Error-Free Data Management: Structured data entry in different sheets ensures consistency and accuracy, reducing human errors.
Click to A/B Testing KPI
Best Practices for Using the A/B Testing KPI Dashboard
Define Clear KPIs Before Testing
Ensure your KPIs align with your test objectives. Common A/B testing KPIs include:
- Conversion Rate
- Bounce Rate
- Click-Through Rate (CTR)
- Revenue Per Visitor (RPV)
Maintain Consistent Data Entry
- Regularly update the Actual, Target, and Previous Year sheets to ensure the dashboard reflects accurate results.
Analyze Both Short-Term and Long-Term Trends
- While MTD numbers show immediate impact, YTD trends provide a broader view of performance improvements.
Utilize Conditional Formatting for Quick Insights
- Highlight performance deviations with color-coded up/down arrows for easy interpretation.
Keep Historical Data for Future Benchmarking
- Save and maintain previous A/B test results to enhance forecasting and strategy development.
Conclusion
The A/B Testing KPI Dashboard in Excel is a powerful tool that helps organizations effectively measure, compare, and optimize A/B test results. By leveraging structured data entry, visual reports, and performance trends, businesses can make informed decisions that drive higher conversions and better user experiences.
Frequently Asked Questions (FAQs)
What is A/B Testing, and why is it important?
A/B Testing is a method of comparing two versions of a webpage, email, or other digital content to determine which performs better. It helps in optimizing marketing strategies, user experience, and conversion rates.
Can I customize the KPIs in the dashboard?
Yes! You can easily add new KPIs by updating the KPI Definition Sheet and modifying the formulas accordingly.
How do I update the dashboard with new test results?
- Enter actual data in the Actual Numbers Input Sheet.
- Update the Target Sheet and Previous Year Numbers Sheet as needed.
- Select the desired month in the Dashboard Sheet to view real-time updates.
Is this dashboard suitable for non-technical users?
Absolutely! The dashboard is user-friendly and does not require advanced Excel skills. Simply follow the structured input process to view insights.
Can this dashboard be used for multiple A/B tests simultaneously?
Yes! You can extend the dashboard by adding more KPI categories and customizing data input fields to accommodate multiple tests.
Click to A/B Testing KPI
Visit our YouTube channel to learn step-by-step video tutorials
View this post on Instagram