Managing accounts payable efficiently is crucial for any business. It ensures timely payments, maintains healthy supplier relationships, and optimizes cash flow. To streamline this process, a well-structured Accounts Payable KPI Dashboard in Excel provides valuable insights through real-time data visualization.
In this guide, we will explore how this dashboard works, its key features, benefits, and best practices. Additionally, we will discuss frequently asked questions (FAQs) to help you make the most of this tool.
Click to Accounts Payable KPI
What is an Accounts Payable KPI Dashboard?
An Accounts Payable KPI Dashboard is a data-driven tool that helps track and monitor key performance indicators (KPIs) related to a company’s accounts payable function. This dashboard enables businesses to measure efficiency, identify bottlenecks, and enhance decision-making.
Why is it Important?
- It helps in tracking payment trends and identifying delays.
- Provides insights into budget adherence and cost control.
- Enhances transparency in financial transactions.
- Supports strategic decision-making with accurate data.
Key Features of the Accounts Payable KPI Dashboard in Excel
Our Accounts Payable KPI Dashboard comes with seven interactive worksheets that provide in-depth financial analysis:
Click to Accounts Payable KPI
Home Sheet
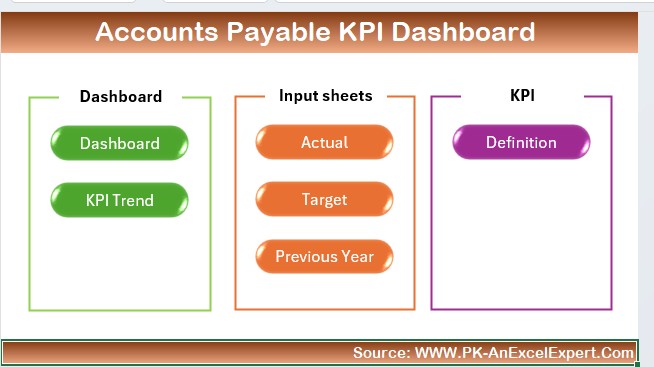
- Acts as the main index page.
- Contains six navigation buttons for quick access to different sections.
- Ensures seamless movement between sheets.
Dashboard Sheet
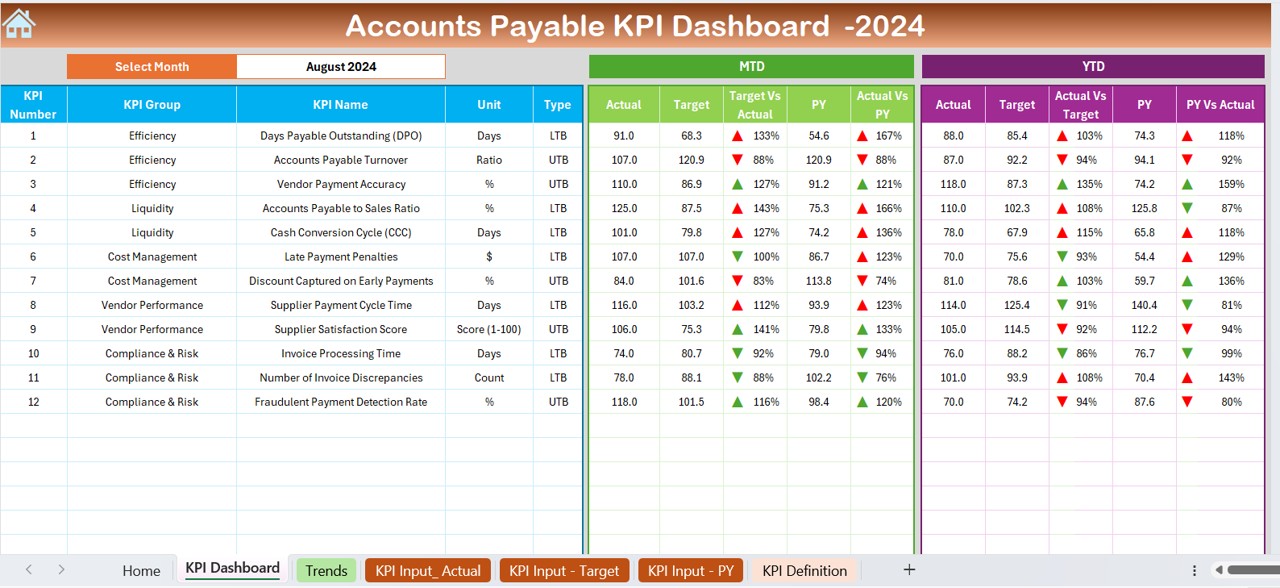
- The core of the dashboard.
- Displays MTD (Month-to-Date) and YTD (Year-to-Date) data.
- Includes drop-down selection for choosing months.
- Uses conditional formatting with up/down arrows to indicate trends.
- Provides comparisons between actual, target, and previous year data.
Click to Accounts Payable KPI
KPI Trend Sheet
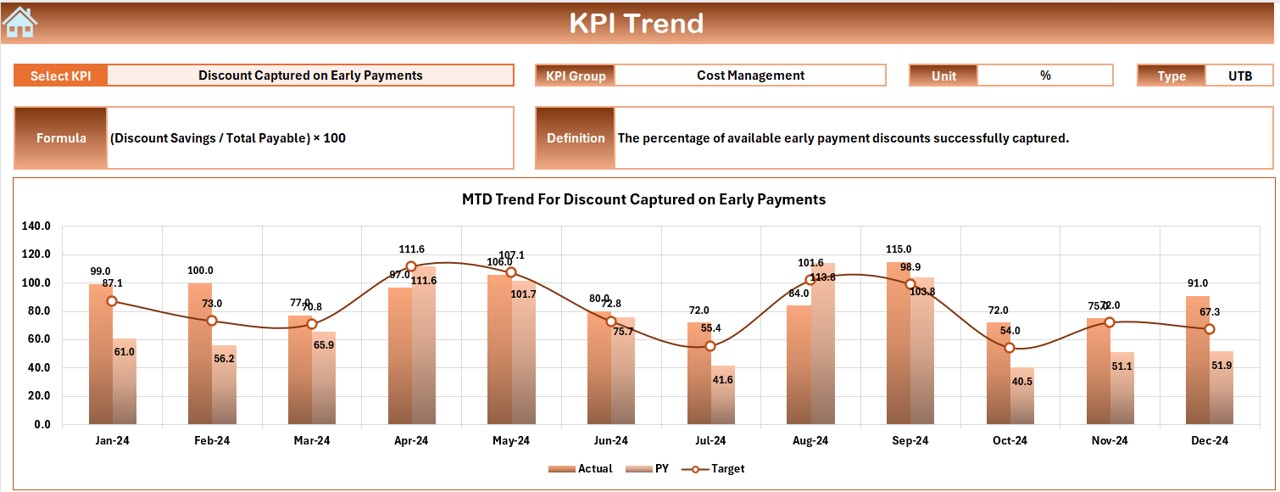
- Tracks the historical performance of each KPI.
- Allows selection of specific KPIs via a drop-down list.
- Displays MTD and YTD trend charts.
- Includes details like KPI Group, Unit, Type (Lower/Upper is better), Formula, and Definition.
Actual Numbers Input Sheet
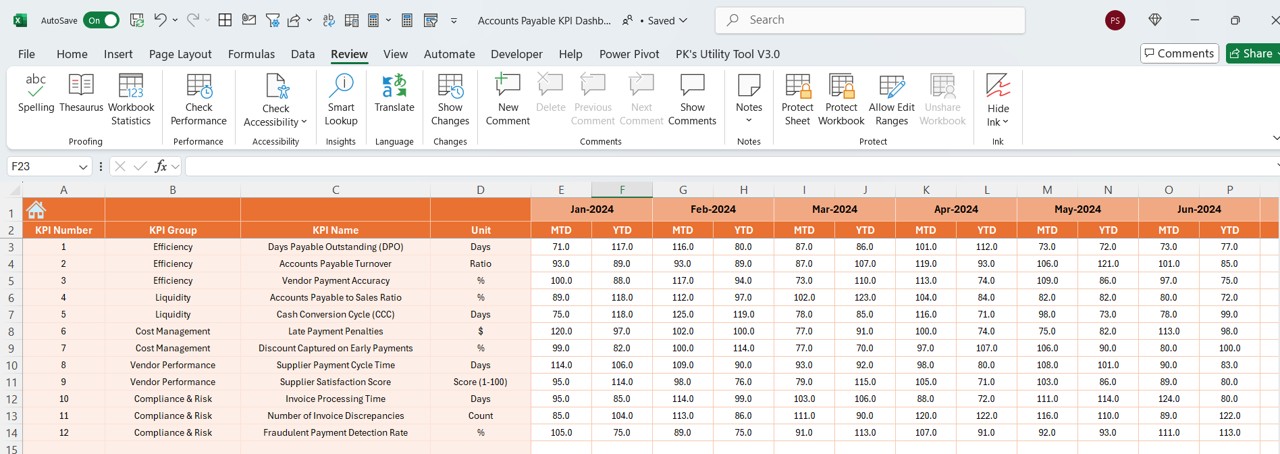
- Data input section for actual values.
- Users can enter MTD and YTD actual numbers for each month.
- Allows month selection via range E1.
Target Sheet
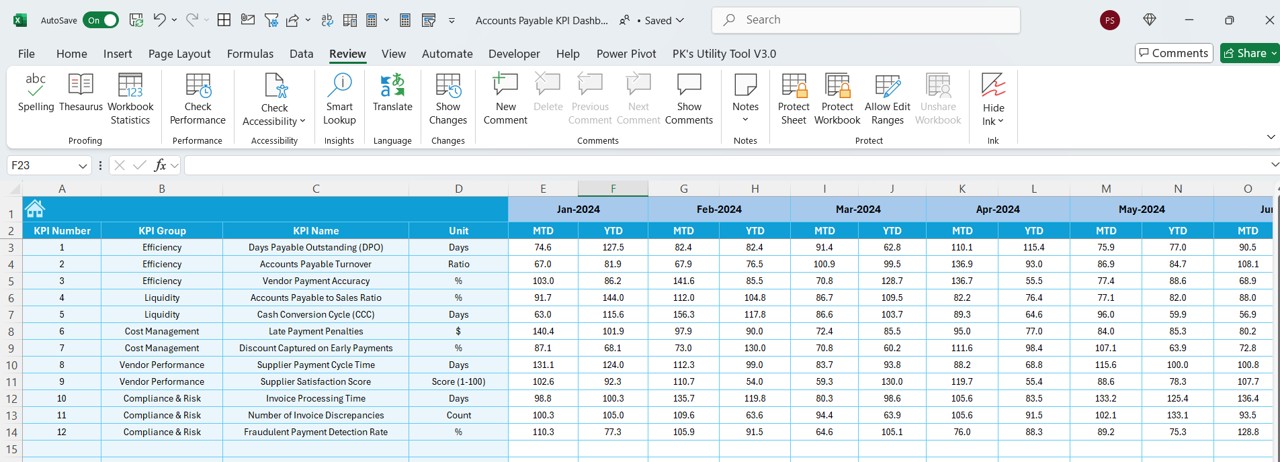
- Enter target values for KPIs.
- Tracks monthly and yearly targets for comparison against actual data.
Previous Year Number Sheet
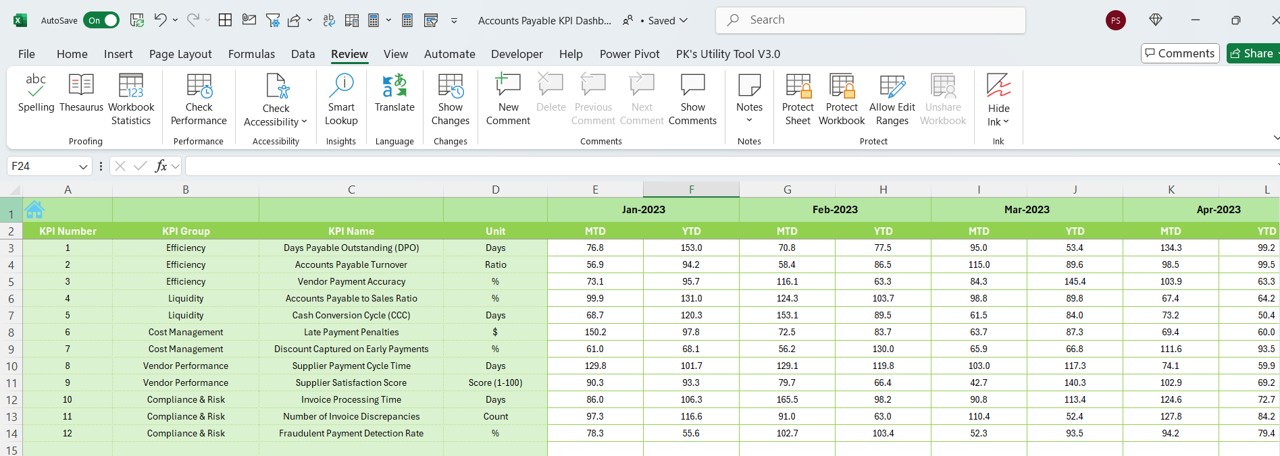
- Stores historical KPI data for last year.
- Allows easy comparison of current vs previous year performance.
KPI Definition Sheet
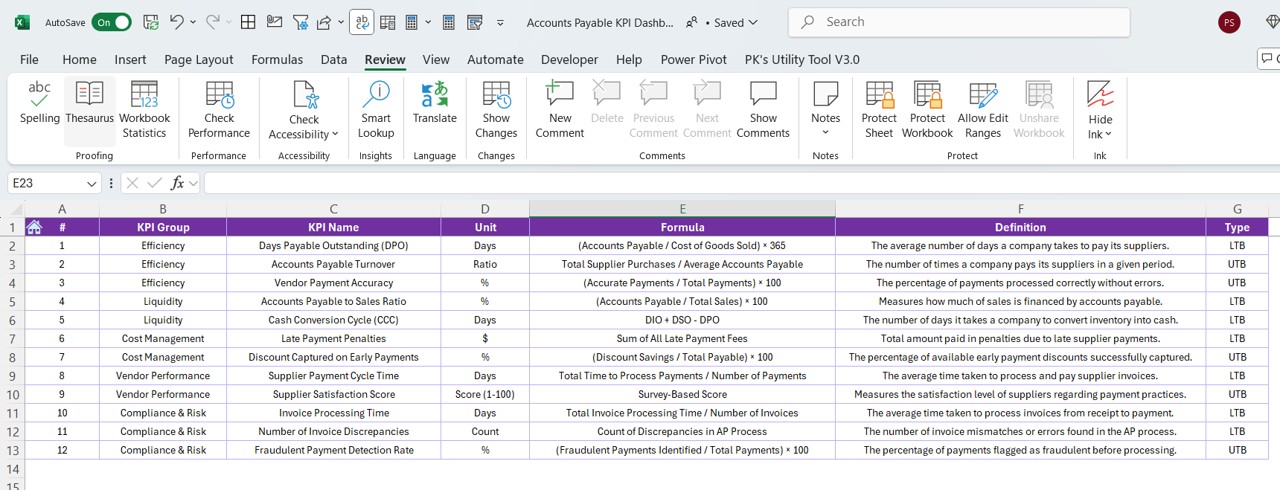
- Acts as a data repository for all KPI definitions.
- Contains fields for KPI Name, KPI Group, Unit, Formula, and Definition.
Advantages of Using an Accounts Payable KPI Dashboard
Click to Accounts Payable KPI
Real-time Insights
Stay updated with live data tracking and monitor KPI performance instantly.
Improved Decision-Making
Data-driven reports help optimize payments and reduce financial risks.
Enhanced Cash Flow Management
Ensures timely payments, helping to avoid late fees and maintain supplier trust.
Performance Benchmarking
Compare current data with historical trends to measure improvement.
Increased Accuracy
Minimizes errors with structured data input and automated calculations.
Best Practices for Using the Accounts Payable KPI Dashboard
Regular Data Updates
Ensure actual numbers, targets, and previous year data are updated frequently.
Monitor KPI Trends
Use the KPI Trend sheet to analyze patterns and make proactive decisions.
Leverage Conditional Formatting
Identify key trends using visual indicators like up/down arrows.
Set Realistic Targets
Use the Target Sheet to define achievable goals based on historical performance.
Utilize Drop-down Selections
Make use of the month and KPI selection drop-downs to analyze specific data points.
Conclusion
An Accounts Payable KPI Dashboard in Excel is an essential tool for finance professionals looking to streamline accounts payable management. With its interactive dashboards, historical comparisons, and real-time insights, this dashboard ensures efficient financial control and better decision-making.
Frequently Asked Questions (FAQs)
Click to Accounts Payable KPI
What are the most important KPIs in accounts payable?
- The most critical KPIs include:
- Days Payable Outstanding (DPO) – Measures the average time to pay suppliers.
- Invoice Processing Time – Tracks how long it takes to process an invoice.
- Payment Accuracy Rate – Determines the percentage of correct payments.
- Accounts Payable Turnover – Measures how quickly liabilities are settled.
How can I customize the dashboard for my business?
- Modify the KPI Definition Sheet to include your company-specific KPIs.
- Adjust target values in the Target Sheet as per your financial goals.
- Use Excel formulas and charts to add custom visualizations.
How frequently should I update the dashboard?
It is recommended to update the dashboard monthly to ensure accurate KPI tracking.
Can this dashboard handle multiple currencies?
Yes! You can incorporate currency conversion formulas to track expenses across different currencies.
Do I need advanced Excel skills to use this dashboard?
No! This dashboard is designed to be user-friendly with drop-downs, pre-set formulas, and automated calculations.
Click to Accounts Payable KPI
Visit our YouTube channel to learn step-by-step video tutorials
View this post on Instagram