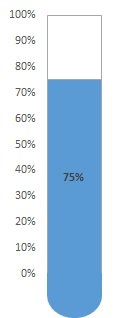
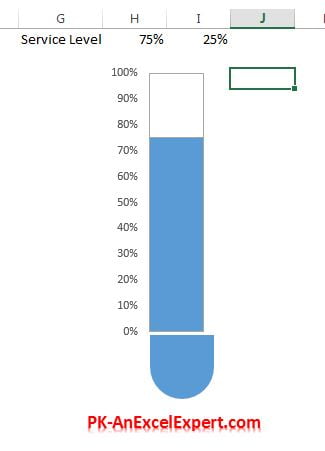
A Chart for KPI Metrics
Test tube chart can be used to show KPI metrics performance like Service Level, Quality Score etc.
To create above given chart, below given steps to be followed:
- Put your metric name (like-Service level) on range G1
- Put metric performance on range H1
- Put the formula “=100%-H1” on range I1
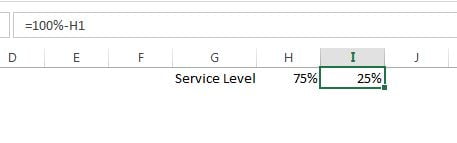
- Select the Range H1:I1
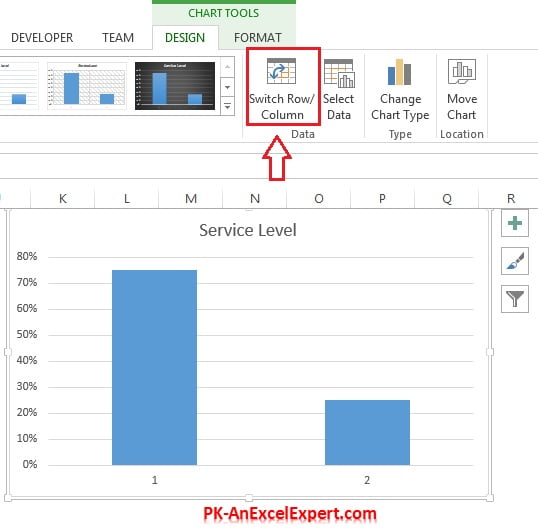
- Go to Insert>>Charts>>2D Column>>insert Stacked Column Chart

Insert Stacked 2D Column Chart - Select the chart and go to Design Tab and click on Switch Row/Column
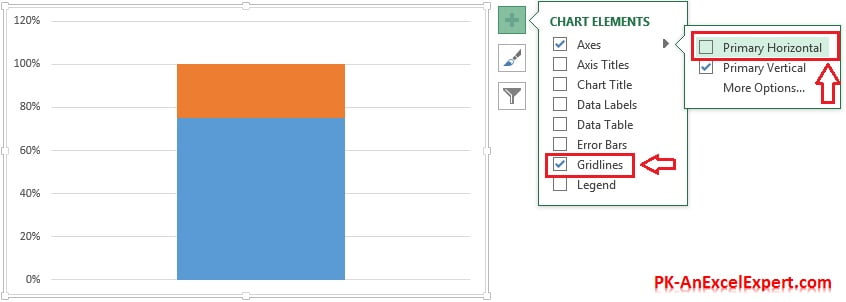
- Click on Chart Element (Plus button) and remove Axes>>Primary Horizontal
- Remove the Gridlines also.
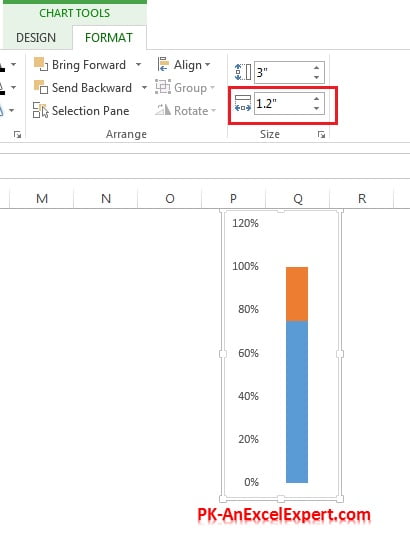
- Select the Chart Area and go to Format tab, change the chart width. Keep it 1.2″
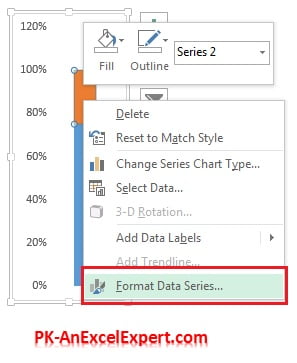
Right click on the column and click on Format Data Series.
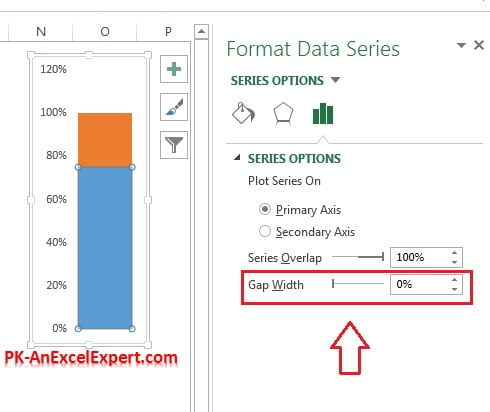
- In Series option change the Gap Width. Take it 0%
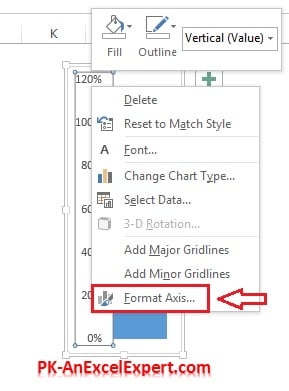
- Right click on Vertical Axis and click on Format Axis
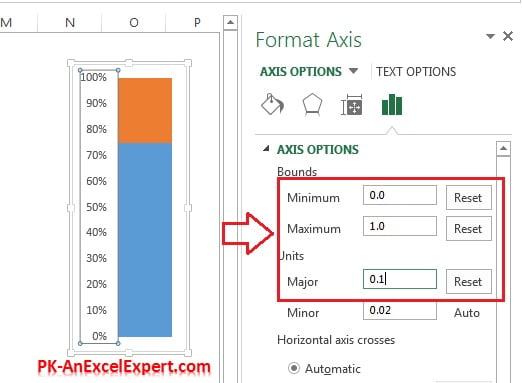
- Under Axis Option change the Minimum, Maximum and Major values
- Take Minimum 0 (if it is already 0 then still type 0 so that it can change to Reset from Auto)
- Take Maximum 1 (if it is already 1 then still type 1 so that it can change to Reset from Auto)
- Take Major 0.1 ((if it is already 0.1 then still type 0.1 so that it can change to Reset from Auto)
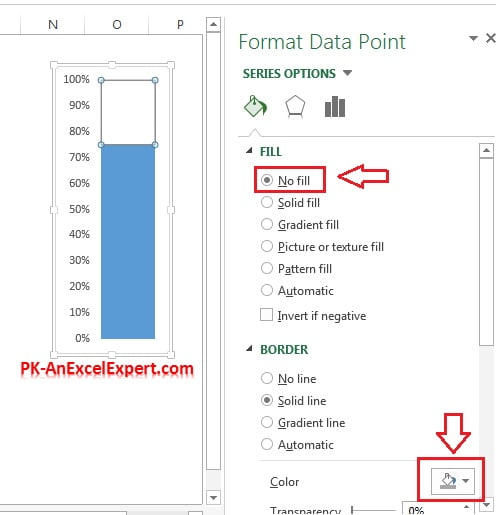
- Double click on column (in Orange Area) and fill it as No fill.
- Change the Border Color as Gray.
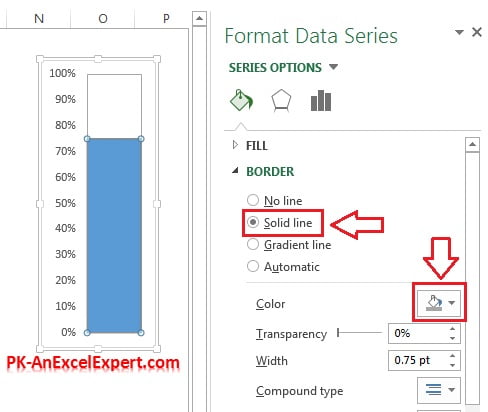
- Double click on Column (Blue Area) and take border color as gray.
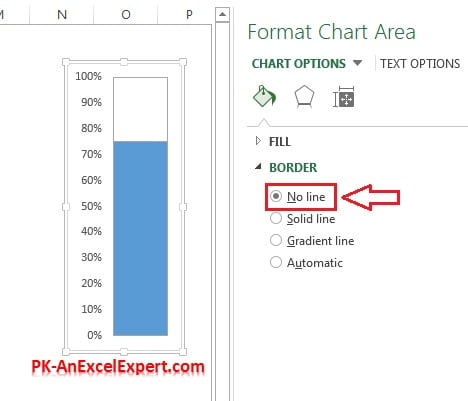
- Select the entire chart and take Border as No Line.
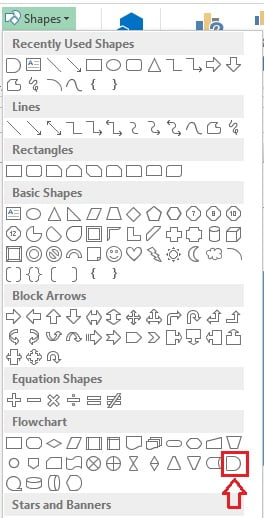
Go to the Insert>>Shapes>>Insert the shaped called Flowchart:Delay
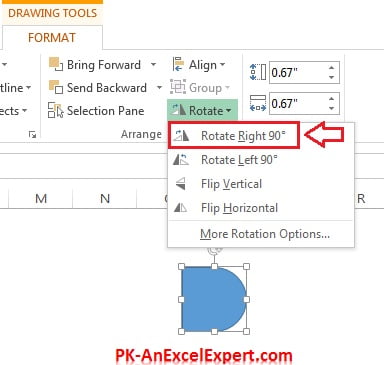
- Select the shape and go to Format>>Rotate>>Rotate Right 90°
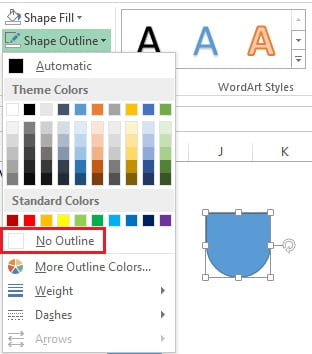
- Select the Shape and go to Format>>Shape Outline>>Select No Outline
- Keep the shape the below the chart
- Change size of shape as per requirements
- Adjust the shape below the chart properly
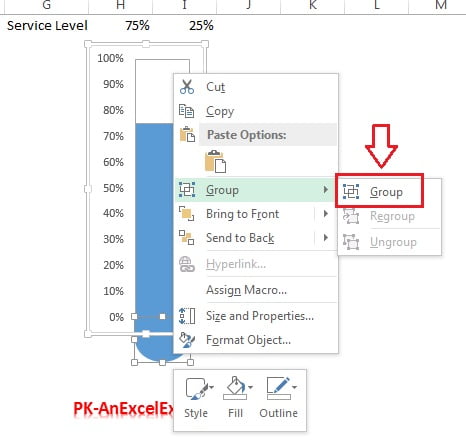
- Select the Shape and Chart together and make the group
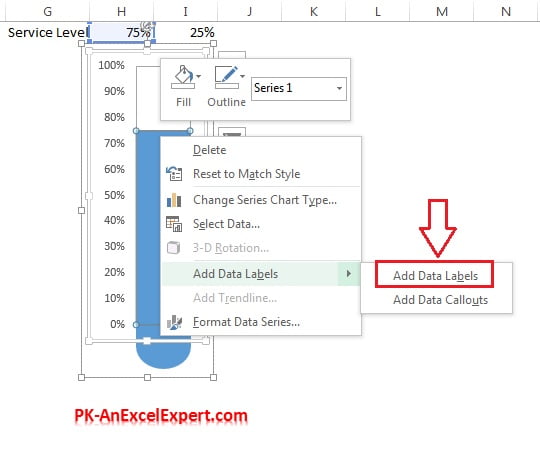
- Right click on chart (in Blue Area) and click on Add data labels.
Our Test Tube Chart is ready. Please download the Excel file for practice.