Agile teams are constantly seeking ways to optimize their performance and improve their project delivery. One of the most effective ways to achieve this is by using Key Performance Indicators (KPIs). By leveraging the power of a KPI dashboard, teams can monitor and evaluate their performance in real-time, ensuring they stay on track with their sprint goals. In this article, we explore the Agile Sprint KPI Dashboard—what it is, how it works, and why it’s essential for project management success.
What is an Agile Sprint KPI Dashboard?
An Agile Sprint KPI Dashboard is a data visualization tool that helps teams monitor, evaluate, and optimize their performance during each sprint cycle. The dashboard displays critical metrics that provide insights into how well the team is performing against their objectives. By tracking these KPIs, teams can easily identify bottlenecks, measure efficiency, and take corrective actions to stay on track.
The Agile Sprint KPI Dashboard includes various metrics across different categories, such as performance, progress tracking, quality, resource allocation, cycle time, and team health. These KPIs serve as benchmarks for success, helping teams maintain their agility and deliver value to stakeholders.
Key Features of the Agile Sprint KPI Dashboard
The Agile Sprint KPI Dashboard is designed to be user-friendly and effective. It is structured in a way that makes it easy for team members and stakeholders to understand key data points quickly. Below are the essential features of this dashboard:
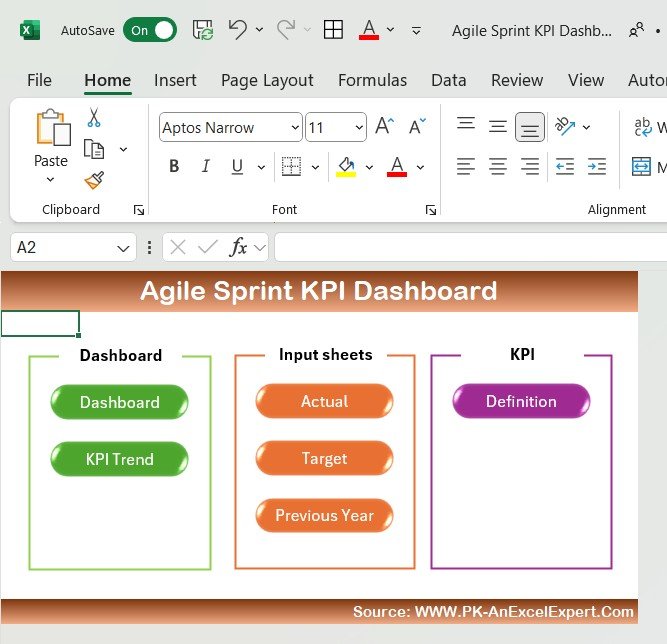
1. Home Sheet
The Home Sheet acts as the central hub of the dashboard. It serves as an index with six buttons that allow users to jump to the respective sheet tab. The Home Sheet gives users easy access to all parts of the dashboard.
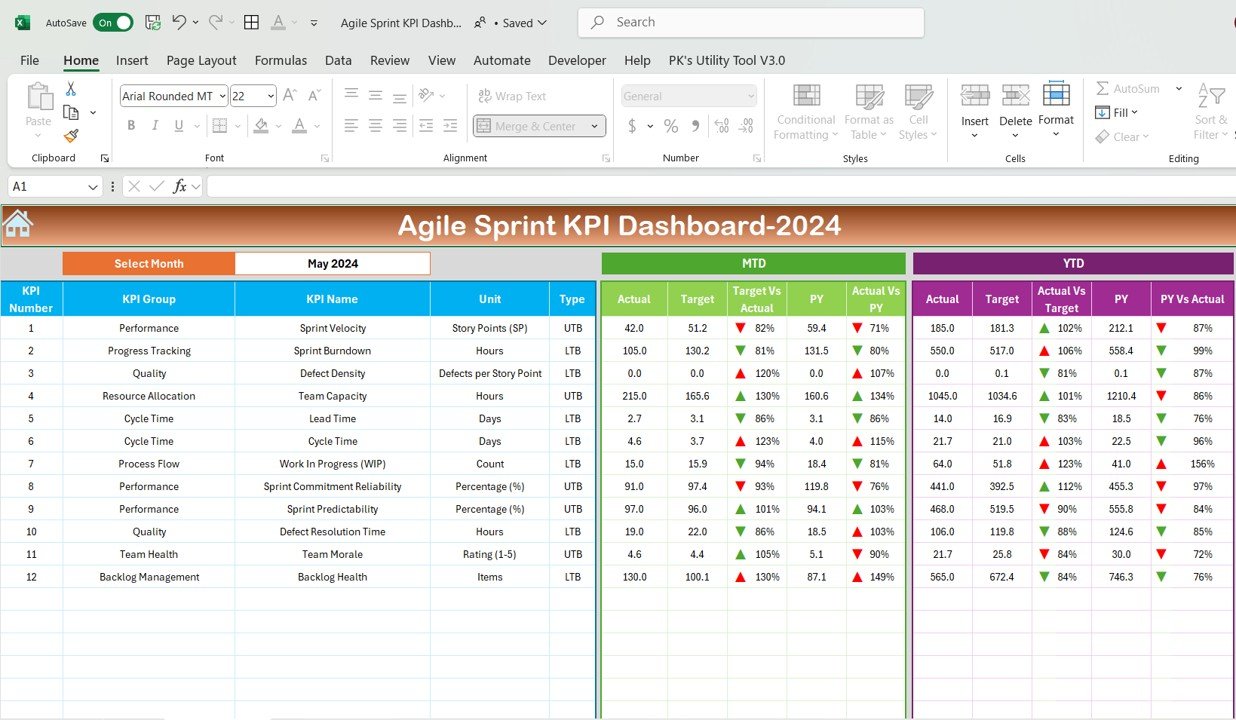
2. Dashboard Sheet Tab
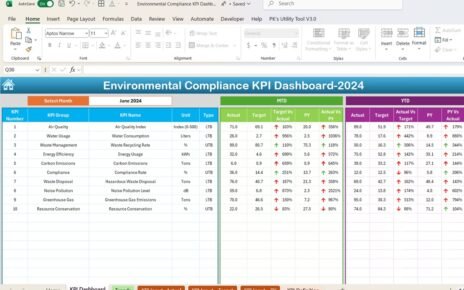
This is the main sheet where all KPI information is displayed. It provides a summary of the team’s progress, performance, and comparison with targets. On this sheet, users can:
- Select the month using a dropdown menu (Range D3).
- View MTD (Month-to-Date) Actual, Target, Previous Year data, and compare Target vs Actual as well as PY (Previous Year) vs Actual with up-down arrow conditional formatting.
- See YTD (Year-to-Date) Actual, Target, Previous Year data, and comparisons.
3. KPI Trend Sheet Tab
This tab allows users to select a specific KPI from the dropdown in Range C3. It displays the following details:
- KPI Group
- Unit of KPI
- Type of KPI (e.g., Lower is Better, Upper is Better)
- Formula for the KPI
- Definition of the KPI

4. Actual Number Sheet Tab
In this sheet, users enter actual numbers for both YTD and MTD for a specific month. You can change the month from Range E1. The input data reflects the team’s actual performance against the targets.
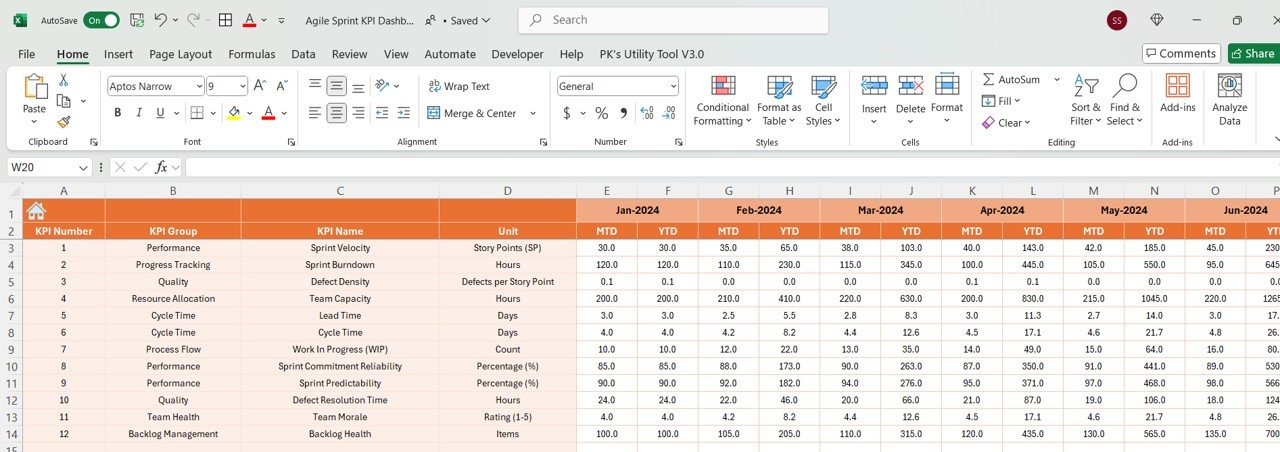
5. Target Sheet Tab
This sheet is where target numbers for each KPI are entered. Both MTD and YTD target values are entered here, providing a benchmark for the team’s performance.

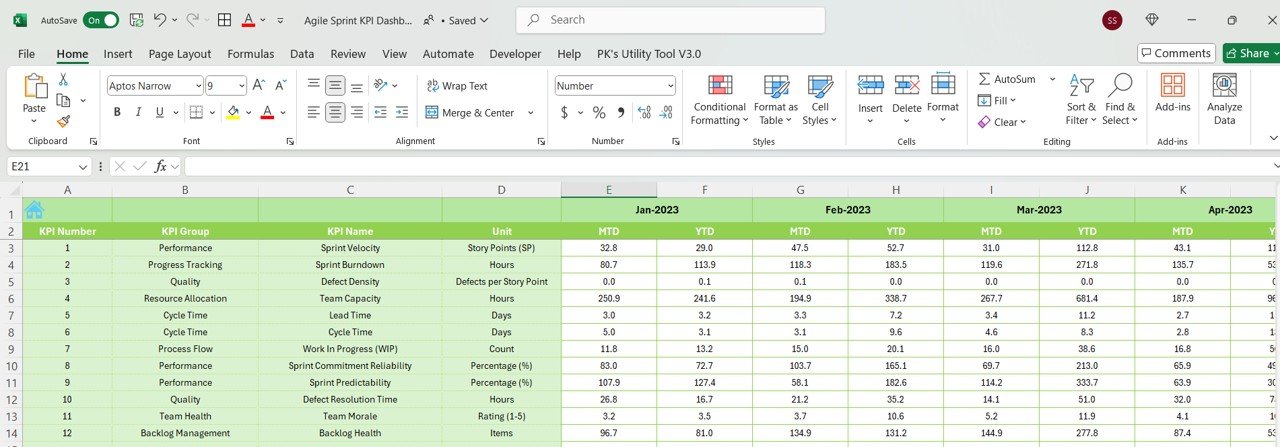
6. Previous Year Number Sheet Tab
In this tab, users input previous year data for comparison with the current year. This allows teams to track progress over time and analyze historical trends.
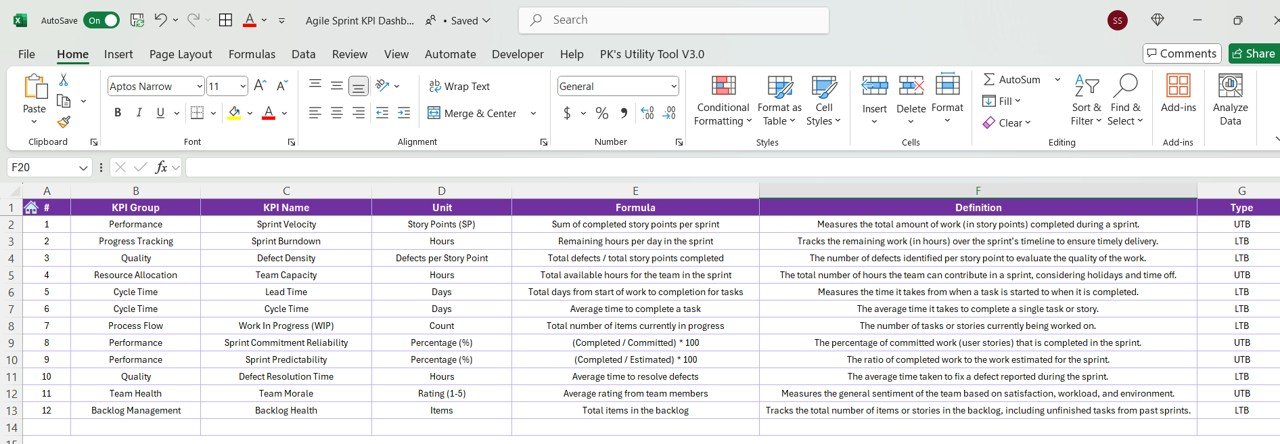
7. KPI Definition Sheet Tab
This tab contains detailed information about each KPI, including:
- KPI Name
- KPI Group
- Unit
- Formula
- Definition
Advantages of Using an Agile Sprint KPI Dashboard
Implementing an Agile Sprint KPI Dashboard offers several key advantages for Agile teams:
- Improved Decision-Making: By having a real-time overview of your team’s performance, you can make more informed decisions about future sprints.
- Increased Transparency: The dashboard provides visibility into progress, allowing everyone in the team to stay aligned on goals.
- Better Performance Tracking: With clear, visual tracking of KPIs, you can easily identify areas of improvement and act on them quickly.
- Optimized Sprint Planning: Understanding sprint velocity and other KPIs helps you plan better for future sprints, making resource allocation more effective.
Opportunities for Improvement in Agile Sprint KPI Dashboard
While the Agile Sprint KPI Dashboard is a powerful tool, there are always opportunities for improvement:
- Customization: Ensure that the dashboard can be easily tailored to fit the unique needs of your team. Each team may have different KPIs, and customization can make the dashboard more relevant.
- Automation: Automate data entry to reduce manual errors and increase efficiency. For instance, pulling data from project management tools can save time.
- User Experience: Continuously improve the user interface to make it more intuitive. A complex dashboard can hinder usability, so keep it simple and easy to navigate.
Best Practices for Using the Agile Sprint KPI Dashboard
To get the most out of your Agile Sprint KPI Dashboard, follow these best practices:
- Regular Updates: Make sure to update the dashboard regularly with the latest MTD and YTD data to maintain accuracy.
- Use Conditional Formatting: Highlight critical data points (e.g., when actual performance is below the target) to make it easy to spot issues.
- Review KPIs Continuously: Don’t just rely on the dashboard to track KPIs. Use it as a tool for regular review and improvement sessions.
- Collaborate on Insights: Involve the whole team in discussions around the dashboard. Use it as a conversation starter during retrospectives to identify improvements.
Conclusion
The Agile Sprint KPI Dashboard is an essential tool for Agile teams aiming to optimize performance, enhance decision-making, and ensure project success. By tracking key performance indicators such as sprint velocity, lead time, and defect density, teams can maintain transparency, align their efforts with sprint goals, and continuously improve. Implementing this dashboard will give you the visibility and insights needed to deliver higher value to stakeholders with every sprint.
Frequently Asked Questions (FAQs)
1. What is the purpose of the Agile Sprint KPI Dashboard?
The Agile Sprint KPI Dashboard helps teams track key performance metrics to ensure that they are on track to meet their sprint goals. It allows teams to monitor performance in real-time, identify bottlenecks, and make adjustments to optimize their efforts.
2. How can the Agile Sprint KPI Dashboard improve team performance?
The dashboard provides transparency, allowing teams to see their progress in relation to targets. It helps identify areas for improvement and enables teams to take corrective actions to stay on course.
3. Can the Agile Sprint KPI Dashboard be customized for different teams?
Yes, the dashboard can be customized to suit the needs of different teams. KPIs can be adjusted, and additional metrics can be added based on the team’s specific objectives.
4. What are some common KPIs used in an Agile Sprint Dashboard?
Some common KPIs include Sprint Velocity, Sprint Burndown, Defect Density, Lead Time, Cycle Time, Work In Progress (WIP), and Team Capacity.
5. How often should the Agile Sprint KPI Dashboard be updated?
The dashboard should be updated regularly with the latest MTD (Month-to-Date) and YTD (Year-to-Date) data. This ensures that the dashboard reflects the team’s current performance accurately.
Visit our YouTube channel to learn step-by-step video tutorials
View this post on Instagram