In today’s competitive agricultural environment, tracking performance indicators is essential to ensure productivity, efficiency, and sustainability. A well-structured Agriculture KPI Dashboard in Excel helps in achieving these goals by providing insights into key performance indicators (KPIs). This dashboard serves as a central hub for monitoring various agricultural metrics, allowing decision-makers to take action based on data-driven insights Agriculture KPI Dashboard in Excel.
Click to buy Agriculture KPI Dashboard in Excel
In this article, we’ll guide you through the structure, key features, best practices, and opportunities for improvement in creating an Agriculture KPI Dashboard in Excel. Additionally, we’ll answer frequently asked questions to clarify common concerns and help you make the most of your Agriculture KPI Dashboard in Excel.
Key Features of the Agriculture KPI Dashboard in Excel
Our Agriculture KPI Dashboard is a ready-to-use template designed to track a wide range of metrics, from energy usage to crop yield. Below are the seven key worksheets included in this dashboard:
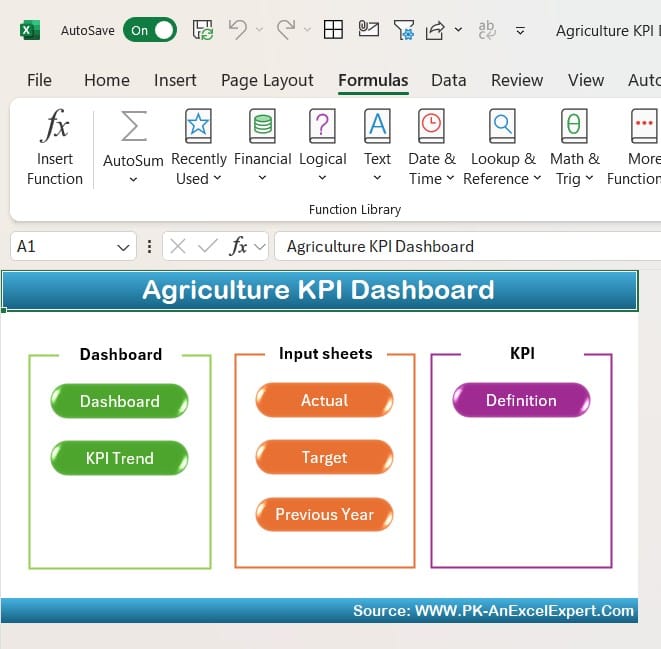
Home Sheet:
Click to buy Agriculture KPI Dashboard in Excel
The Home Sheet serves as the navigation hub of the dashboard. It features six interactive buttons, each linked to a specific worksheet. This design allows users to quickly jump to the desired sheet, streamlining workflow and minimizing time spent searching for data.
Dashboard Sheet Tab:
Click to buy Agriculture KPI Dashboard in Excel
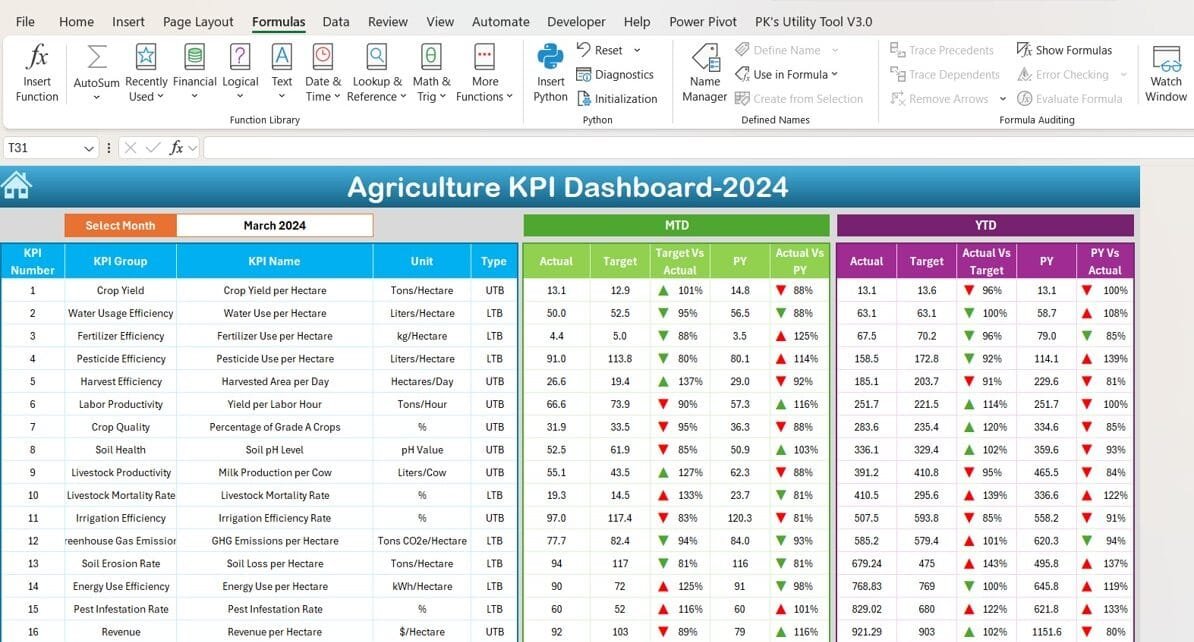
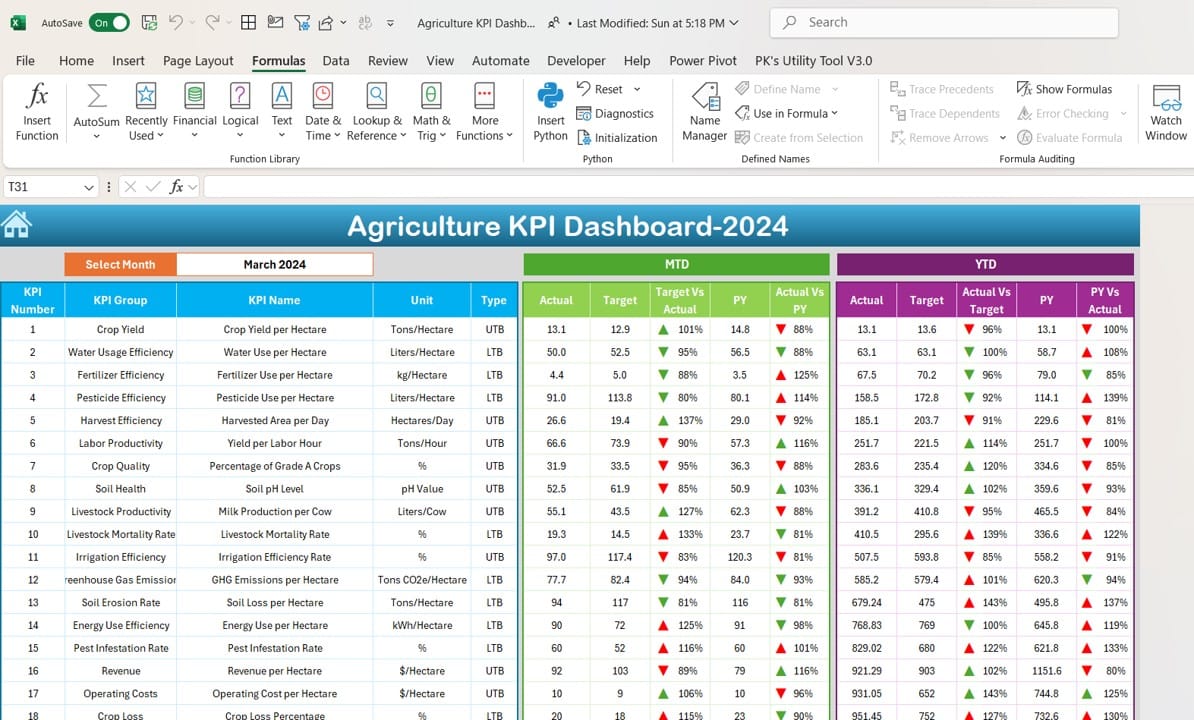
The Dashboard Sheet Tab is the heart of the dashboard. It consolidates all KPI-related data in one place, providing users with a bird’s eye view of the agricultural performance metrics. The key features include:
- A month selector at cell D3 that dynamically changes the data for the selected month.
- Real-time visual comparison between MTD (Month-to-Date) Actual vs. Target and YTD (Year-to-Date) Actual vs. Target, as well as comparisons with Previous Year (PY) data.
- Conditional formatting with up-and-down arrows to highlight performance deviations, ensuring quick identification of areas requiring attention.
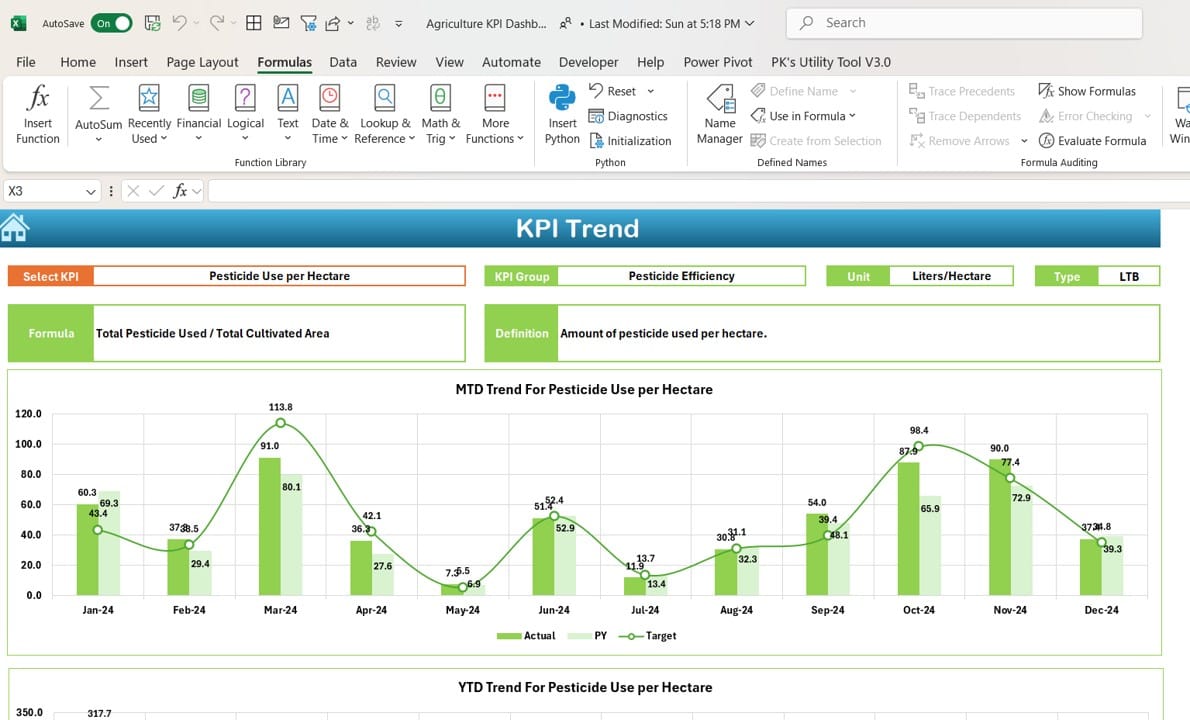
KPI Trend Sheet Tab:
Click to buy Agriculture KPI Dashboard in Excel
The KPI Trend Sheet allows for in-depth analysis of each KPI. This sheet enables users to select a specific KPI from the drop-down menu (available in cell C3) and view the following:
- KPI Group, Unit, Type (whether lower or higher values are better), and Formula to calculate the KPI.
- A chart displaying the MTD and YTD trends for Actual, Target, and Previous Year data, making it easy to visualize how each KPI is progressing over time.
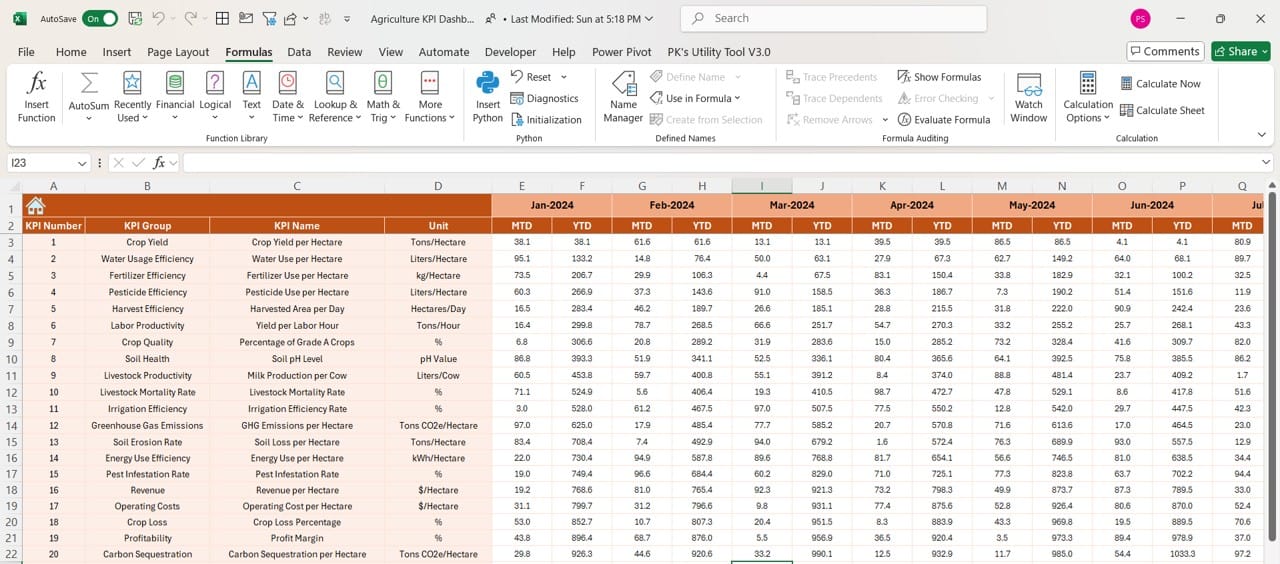
Actual Numbers Input Sheet:
Click to buy Agriculture KPI Dashboard in Excel
The Actual Numbers Input Sheet is where users manually input data. To record actual performance, enter MTD and YTD numbers for each KPI. The dashboard supports month-specific entries, which can be adjusted by updating the start of the year in cell E1.
Target Sheet Tab:
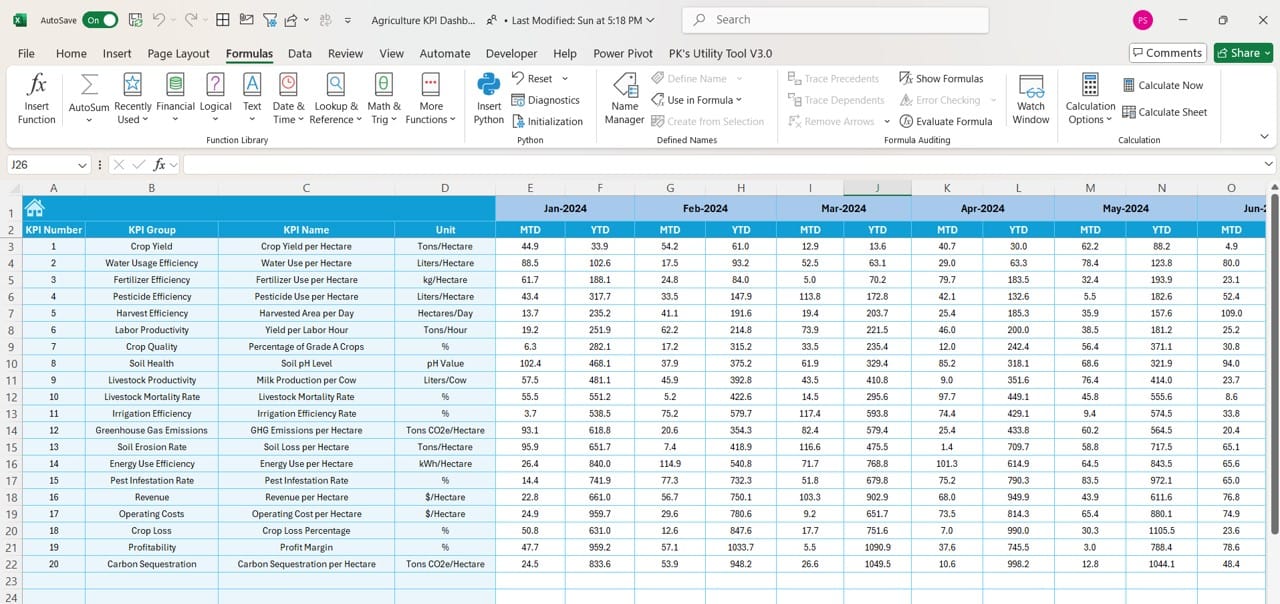
The Target Sheet Tab is dedicated to setting performance benchmarks. Users input target numbers for each KPI on both an MTD and YTD basis. This helps establish realistic goals for the agricultural season, promoting better resource allocation and strategic planning.
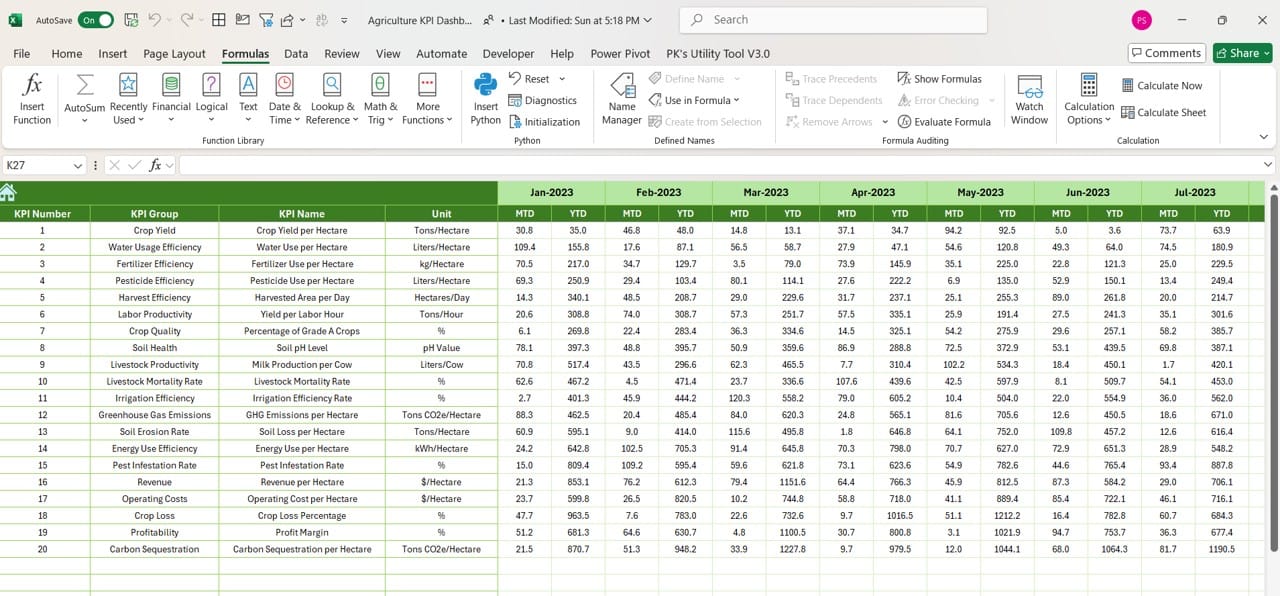
Previous Year Numbers Sheet Tab:
Click to buy Agriculture KPI Dashboard in Excel
In the Previous Year Numbers Sheet, users input data from the prior year, which is crucial for conducting comparative analysis. Historical performance offers valuable insights into trends and deviations, helping organizations assess long-term improvement or decline.
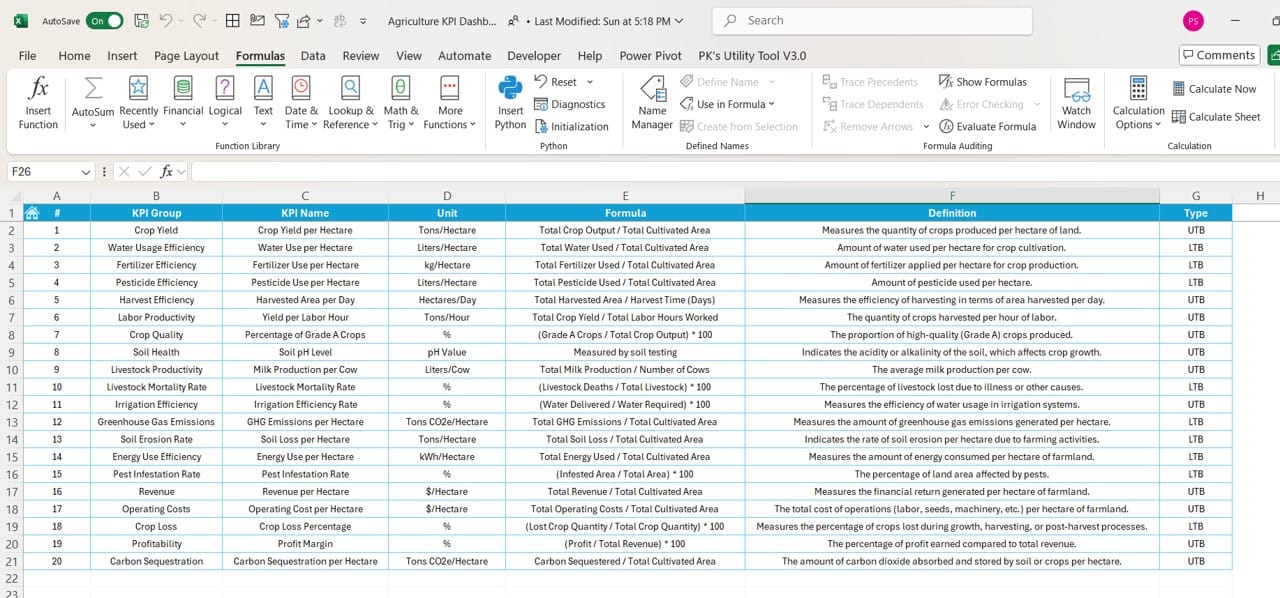
KPI Definition Sheet Tab:
Click to buy Agriculture KPI Dashboard in Excel
The KPI Definition Sheet acts as a reference, providing detailed descriptions for each KPI. Users enter the KPI Name, Group, Unit, Formula, and a brief Definition, ensuring that every metric is clearly understood by all team members.
Advantages of Using an Agriculture KPI Dashboard
Having a comprehensive KPI dashboard offers numerous advantages for agricultural operations. Let’s explore the key benefits:
- Centralized Data Access: A dashboard provides a single platform where all relevant KPIs are displayed, eliminating the need to search across multiple documents or systems.
- Real-Time Insights: By using drop-down menus and dynamically updating charts, users can view real-time data, enabling faster decision-making.
- Enhanced Visibility: With easy-to-read visual elements like charts, conditional formatting, and up/down arrows, teams can quickly identify whether they are on track to meet targets or if corrective actions are needed.
- Benchmarking Capabilities: The inclusion of historical data (via the Previous Year Numbers Sheet) allows for performance benchmarking, giving insight into whether operational changes are effective.
- Flexibility and Customization: Since it is built in Excel, this KPI dashboard is fully customizable. Users can easily modify formulas, add KPIs, or update the layout based on changing business needs.
Click to buy Agriculture KPI Dashboard in Excel
Best Practices for Using an Agriculture KPI Dashboard
Maximizing the value of your KPI dashboard requires following some best practices. Here’s what you should keep in mind:
- Define Relevant KPIs: Choose KPIs that align with your agricultural objectives. Whether it’s tracking crop yield, water usage, or energy consumption, ensure that each metric directly impacts your overall goals.
- Regularly Update Data: A dashboard is only as good as the data it displays. Regularly update your Actual Numbers Input Sheet and Previous Year Numbers Sheet to ensure accuracy in performance reporting.
- Analyze Trends: Use the KPI Trend Sheet to look for patterns over time. Understanding whether performance is improving or declining will help you take proactive measures in your agricultural strategy.
- Set Realistic Targets: Input achievable goals into the Target Sheet Tab. Setting overly ambitious targets can be demoralizing if they’re consistently missed, while targets that are too easy won’t push your team to excel.
- Keep the Dashboard Simple: Avoid cluttering the dashboard with too many KPIs. Focus on the metrics that are most crucial to your operation. A clean and focused dashboard will improve usability and data interpretation.
Click to buy Agriculture KPI Dashboard in Excel
Opportunities for Improvement in the Agriculture KPI Dashboard
While this dashboard offers a wealth of features, there is always room for improvement. Here are a few areas where enhancements could be made:
- Automation of Data Entry: One of the biggest challenges with any Excel-based tool is the manual data entry required. Automating the data input process by linking the Excel dashboard to external data sources (such as field sensors or agricultural management software) would save time and reduce errors.
- Mobile Compatibility: Excel is not the most mobile-friendly platform. A future version of this dashboard could be converted into a web-based application, making it accessible from smartphones and tablets for users in the field.
- Advanced Visualizations: While the current dashboard features conditional formatting and basic charts, adding advanced visualizations such as heat maps or geographic data mapping would provide deeper insights into performance across different farm locations or regions.
- Collaboration Features: Integrating collaboration tools (such as shared cloud-based documents) could allow team members to update the dashboard simultaneously, improving teamwork and real-time decision-making.
Conclusion
The Agriculture KPI Dashboard in Excel is a powerful tool that allows agricultural businesses to track and analyze performance metrics efficiently. From the Dashboard Sheet Tab providing a comprehensive overview to the KPI Trend Sheet helping identify patterns, this dashboard is essential for optimizing productivity, improving resource allocation, and ensuring sustainable agricultural practices.
By following the best practices outlined in this guide and continuously improving the tool, you can ensure that your agricultural operations stay ahead of the competition and meet their performance goals.
Click to buy Agriculture KPI Dashboard in Excel
Frequently Asked Questions (FAQs)
- How do I update the dashboard for a new month?
To update the dashboard for a new month, go to the Dashboard Sheet Tab and use the drop-down in cell D3 to select the desired month. All data will adjust based on the selected month.
- Can I customize the KPIs in the dashboard?
Yes, you can customize the KPIs by modifying the KPI Definition Sheet Tab. This sheet allows you to define new KPIs, update formulas, and set the unit of measurement.
- Is the dashboard suitable for large-scale agricultural operations?
Absolutely. The dashboard is scalable and can be adapted to suit the needs of both small farms and large-scale agricultural enterprises.
- Can I track energy usage in this dashboard?
Yes, this dashboard is designed to track Energy KPIs alongside Agriculture KPIs. You can input energy consumption data in the respective sheets for MTD and YTD analysis.
- How can I ensure data accuracy?
To ensure accuracy, make sure to regularly update the Actual Numbers Input Sheet and cross-check entries with field data. Automating the data collection process through external integrations can also help reduce manual errors.
- Is this dashboard mobile-friendly?
While the dashboard works best on desktop, a more mobile-friendly solution could be achieved by converting the Excel dashboard into a web-based tool.
Click to buy Agriculture KPI Dashboard in Excel
This comprehensive guide helps users get the most out of the Agriculture KPI Dashboard in Excel, ensuring that their agricultural operations run smoothly and efficiently. Whether you’re monitoring crop yield or energy usage, this dashboard provides all the insights you need to make informed decisions.
Visit our YouTube channel to learn step-by-step video tutorials
View this post on Instagram
Click to buy Agriculture KPI Dashboard in Excel