Artificial Intelligence (AI) has become a transformative force across industries, revolutionizing the way businesses and governments function. With the increasing reliance on AI, ensuring ethical standards and transparency in AI systems is more important than ever. One of the most effective ways to monitor and evaluate the ethical performance of AI systems is through the use of Key Performance Indicators (KPIs). A Artificial Intelligence Ethics KPI Dashboard in Power BI is a powerful tool that allows organizations to track and assess the ethical performance of their AI systems.
In this article, we will delve into the specifics of the Artificial Intelligence Ethics KPI Dashboard in Power BI, its features, advantages, opportunities for improvement, best practices, and address some frequently asked questions.
What is an Artificial Intelligence Ethics KPI Dashboard?
An Artificial Intelligence Ethics KPI Dashboard is a tool that allows organizations to track the performance of AI systems based on ethical considerations. These KPIs measure aspects such as fairness, transparency, accountability, and bias in AI models. By leveraging a dashboard in Power BI, organizations can easily visualize the health of their AI models and make data-driven decisions to improve their ethical standards.
Power BI, a leading business analytics tool by Microsoft, allows users to visualize data, track trends, and make interactive reports. By creating a KPI dashboard specifically for AI ethics, businesses can ensure that their AI systems align with ethical practices, meet compliance standards, and are transparent in their decision-making processes.
Key Features of the Artificial Intelligence Ethics KPI Dashboard
The Artificial Intelligence Ethics KPI Dashboard in Power BI is designed to track various KPIs that assess the ethical performance of AI models. This ready-to-use dashboard comes with three key pages:
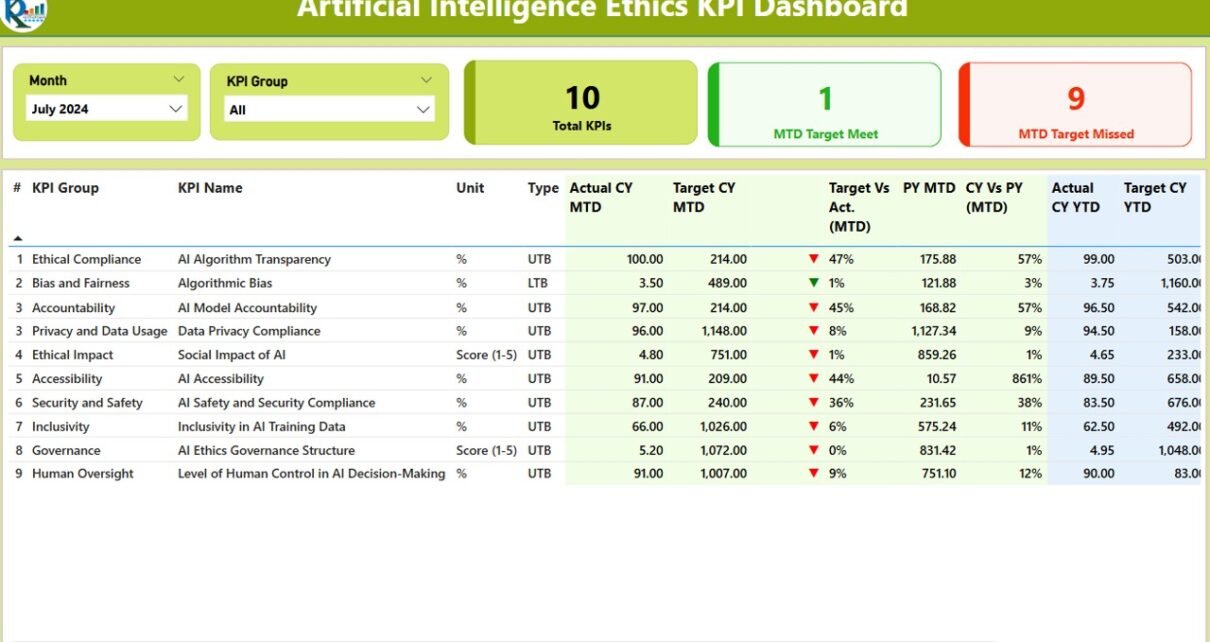
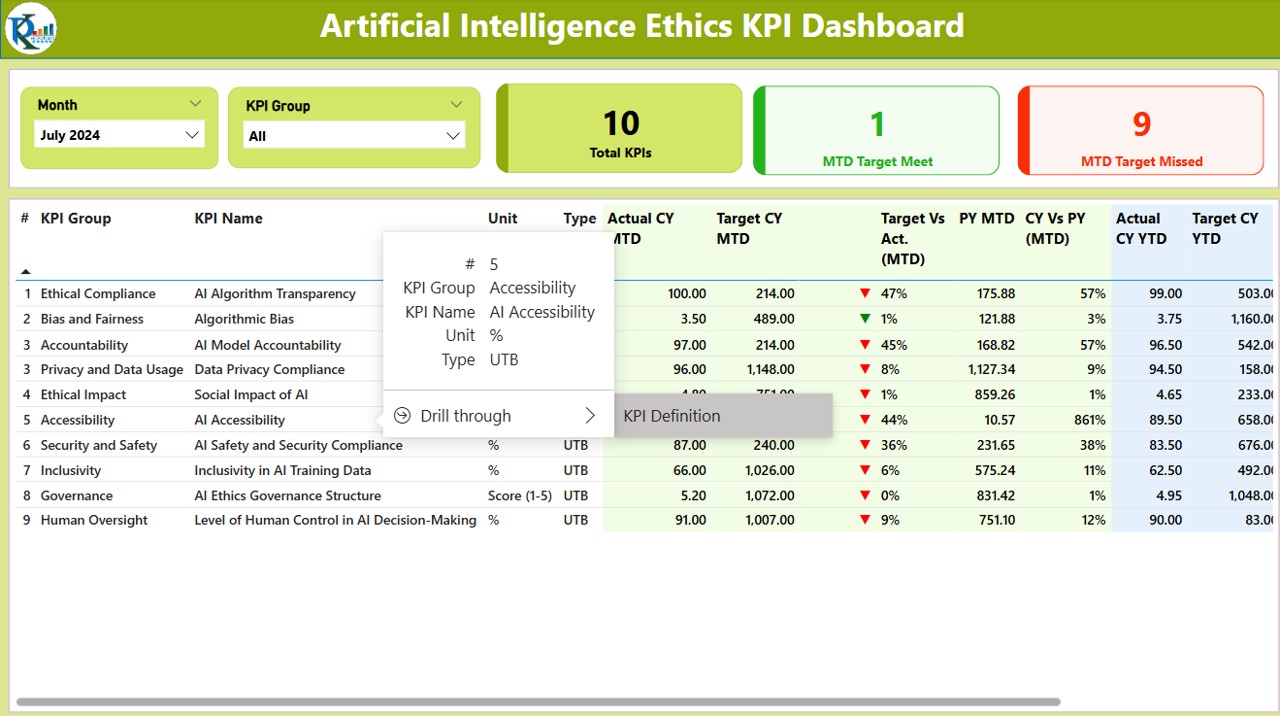
1. Summary Page
The Summary Page serves as the main page of the dashboard. It provides a high-level overview of the KPIs, their targets, and performance. On this page, users can interact with several elements, such as slicers for month and KPI group, as well as cards displaying KPIs like total count, target met, and target missed for the current month.
Key components of the Summary Page include:
- KPI Number: A unique sequence number assigned to each KPI.
- KPI Group: The group or category to which the KPI belongs.
- KPI Name: The name of the specific KPI.
- Unit: The unit of measurement for the KPI.
- Type: Defines whether the KPI is “Lower the Better” (LTB) or “Upper the Better” (UTB).
- MTD and YTD Actuals vs. Targets: Displays the actual values and target values for the current year month-to-date (MTD) and year-to-date (YTD), along with a comparison to the previous year’s MTD and YTD data.
- Icons: Green and red arrows (▲▼) indicate whether the KPIs are on target.
- Target vs. Actual Percentages: Displays the percentage of the actual number versus the target number for both MTD and YTD.
This page offers users a comprehensive view of the overall ethical performance of AI models and provides them with the necessary information to make informed decisions about improvements.
Click to buy Artificial Intelligence Ethics KPI Dashboard in Power BI
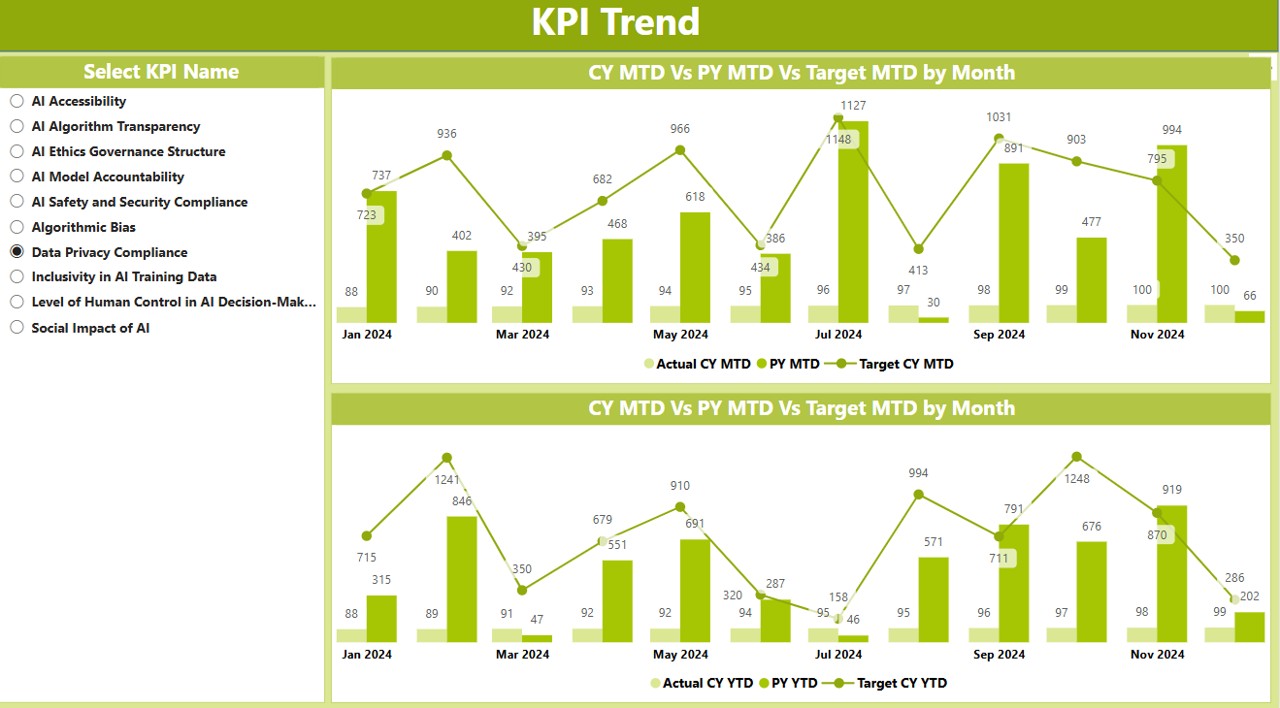
2. KPI Trend Page
The KPI Trend Page is designed to showcase the trends of KPIs over time. It features two combo charts that compare the actual numbers for the current year and previous year, as well as the targets for both MTD and YTD. A slicer is available for users to select specific KPIs, providing a deeper dive into the trends for each.
Click to buy Artificial Intelligence Ethics KPI Dashboard in Power BI
3. KPI Definition Page
The KPI Definition Page provides detailed information about each KPI, including its formula, definition, and how it aligns with ethical standards. This page is designed as a drill-through page, meaning users can click on a specific KPI from the summary page and be directed to the KPI Definition Page for more detailed information.
Click to buy Artificial Intelligence Ethics KPI Dashboard in Power BI
This page ensures that users understand the significance of each KPI and its role in assessing the ethical performance of AI systems. The detailed breakdown of formulas and definitions provides transparency and clarity.
Excel Data for the AI Ethics KPI Dashboard
The Artificial Intelligence Ethics KPI Dashboard in Power BI relies on an Excel data source. To make the most of the dashboard, users must input data into three worksheets:
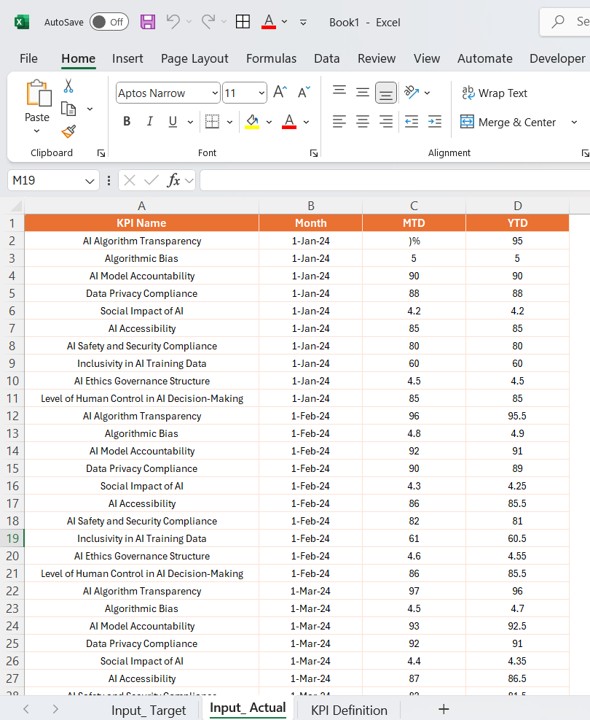
1. Input_Actual Sheet Tab
In this sheet, users must fill in the actual numbers for the KPIs, including MTD and YTD values. The data for each KPI should correspond to the selected month, with the first date of the month used for the input.
Click to buy Artificial Intelligence Ethics KPI Dashboard in Power BI
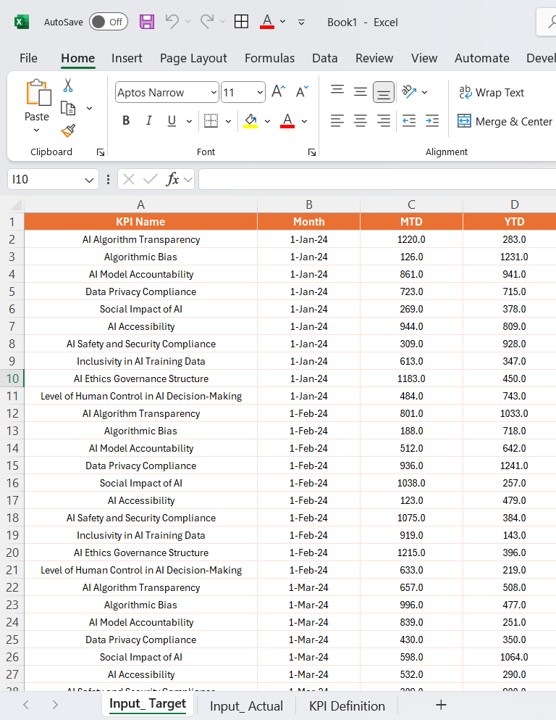
2. Input_Target Sheet Tab
This sheet captures the target values for each KPI, including both MTD and YTD targets. Users must enter the target numbers based on organizational or regulatory goals.
Click to buy Artificial Intelligence Ethics KPI Dashboard in Power BI
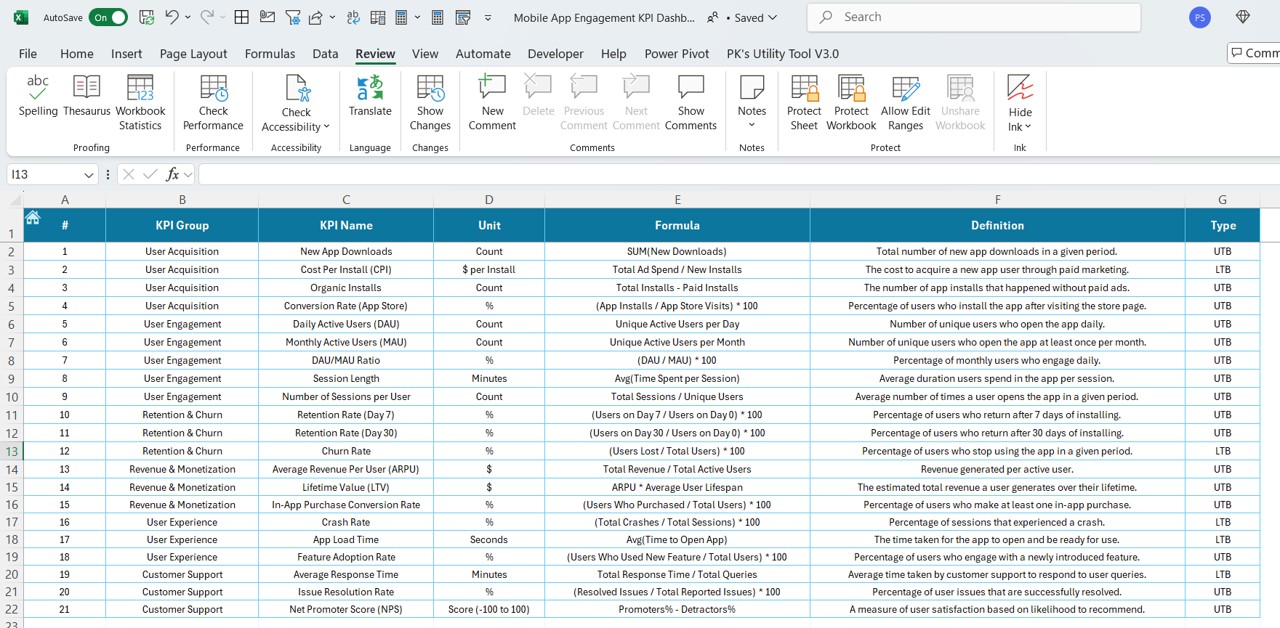
3. KPI Definition Sheet Tab
This sheet contains the details for each KPI, including the KPI number, name, unit of measurement, formula, definition, and whether it’s an LTB or UTB metric.
Click to buy Artificial Intelligence Ethics KPI Dashboard in Power BI
Advantages of Using the Artificial Intelligence Ethics KPI Dashboard
The Artificial Intelligence Ethics KPI Dashboard offers several advantages for organizations that are working with AI systems. By using this dashboard, businesses can ensure that their AI models align with ethical guidelines and provide transparency in their decision-making processes.
- Improved Transparency: The dashboard allows businesses to track the ethical performance of their AI systems and make this data easily accessible to stakeholders. This level of transparency is essential for building trust in AI technologies and ensuring that they are developed and deployed responsibly.
- Enhanced Decision-Making: By visualizing KPIs in a user-friendly Power BI dashboard, businesses can make more informed decisions about their AI systems. The dashboard enables teams to track the performance of AI models over time, identify areas for improvement, and take corrective actions when necessary.
- Monitoring Ethical Compliance: With the growing focus on ethical standards in AI, organizations can use the KPI dashboard to monitor their compliance with ethical guidelines. By regularly assessing KPIs related to fairness, transparency, and accountability, businesses can ensure that their AI models meet ethical requirements and comply with regulations.
- Data-Driven Insights: The dashboard provides valuable data-driven insights that help organizations identify trends, track progress, and make adjustments to their AI models. This data can be used to refine AI algorithms, improve outcomes, and address any potential ethical issues that arise.
Opportunities for Improvement in the Artificial Intelligence Ethics KPI Dashboard
While the Artificial Intelligence Ethics KPI Dashboard offers significant value, there are always opportunities for improvement. Here are some areas where the dashboard can be enhanced:
- Integration with Real-Time Data: Currently, the dashboard relies on manually inputting data through Excel. To improve its functionality, integrating real-time data from AI systems can ensure that the dashboard always reflects the most current performance metrics. This integration can also automate the data-entry process, saving time and reducing the risk of errors.
- Adding Predictive Analytics: Incorporating predictive analytics into the dashboard could enhance its usefulness. By leveraging historical data, the dashboard could forecast future ethical performance trends, helping organizations anticipate potential ethical risks and take proactive measures.
- Enhanced Customization: Allowing users to customize the dashboard even further could make it more flexible for different use cases. For example, users could customize the KPIs displayed, set their own thresholds for ethical performance, or apply different color themes to represent different levels of compliance.
Best Practices for Using the Artificial Intelligence Ethics KPI Dashboard
To make the most of the Artificial Intelligence Ethics KPI Dashboard, here are some best practices to follow:
- Regularly Update the Data: Ensure that the data in the Excel sheets is updated regularly to reflect the most accurate and up-to-date information. This will help you track the performance of your AI systems over time and identify areas for improvement.
- Customize KPIs to Fit Your Needs: While the default KPIs in the dashboard are useful for assessing general ethical performance, you may want to customize them to align with your specific organizational goals. Tailor the KPIs to reflect the unique ethical concerns of your AI systems.
- Use the Dashboard to Drive Continuous Improvement: The dashboard provides insights into areas where your AI systems may not be performing ethically. Use this information to drive continuous improvement in your models and ensure that they are always meeting ethical standards.
- Share the Dashboard with Stakeholders: Make the dashboard accessible to all relevant stakeholders, including data scientists, ethics officers, and regulatory bodies. This will foster transparency and accountability across the organization and help ensure that your AI models are being developed in a responsible manner.
Conclusion
The Artificial Intelligence Ethics KPI Dashboard in Power BI is an essential tool for tracking the ethical performance of AI models. It provides businesses with the transparency, data-driven insights, and compliance monitoring needed to ensure that AI systems meet ethical guidelines. By following the best practices and exploring opportunities for improvement, organizations can make their AI systems more ethical, transparent, and responsible.
Frequently Asked Questions (FAQs)
What is the purpose of the Artificial Intelligence Ethics KPI Dashboard?
The dashboard tracks and evaluates the ethical performance of AI systems using key performance indicators (KPIs) related to fairness, transparency, accountability, and bias.
How does the Artificial Intelligence Ethics KPI Dashboard help organizations?
The dashboard provides a visual and interactive way to monitor the ethical performance of AI models, helping organizations ensure compliance with ethical guidelines and make informed decisions about their AI systems.
What data is required for the Artificial Intelligence Ethics KPI Dashboard?
The dashboard requires data from three Excel sheets: Input_Actual, Input_Target, and KPI_Definition, which include the actual and target values for each KPI, as well as the KPI definitions.
Can the Artificial Intelligence Ethics KPI Dashboard be customized?
Yes, the dashboard can be customized to fit your organization’s specific ethical concerns. You can add new KPIs, modify existing ones, and adjust the layout to suit your needs.
How can I improve the performance of my AI models using this dashboard?
By regularly reviewing the ethical performance of your AI systems through the dashboard, you can identify areas for improvement, refine your models, and ensure that they align with ethical standards.
Visit our YouTube channel to learn step-by-step video tutorials
Click to buy Artificial Intelligence Ethics KPI Dashboard in Power BI