Managing employee attendance and overtime is crucial for any organization, regardless of its size. Accurate tracking of these metrics ensures compliance with labour laws, helps in optimizing workforce management, and plays a significant role in payroll processing. With the advent of technology, Excel has become an indispensable tool for businesses to manage and analyse this data effectively. In this article, we’ll explore the Attendance and Overtime Dashboard in Excel, a ready-to-use template designed for both personal and office use.
We’ll delve into the features of this dashboard, its advantages, best practices for utilization, opportunities for improvement, and answer some frequently asked questions. By the end of this article, you’ll have a comprehensive understanding of how to leverage this tool to enhance your organization’s attendance and overtime tracking processes.
Key Features of the Attendance and Overtime Dashboard
This Excel dashboard is designed with five key worksheets, each serving a distinct purpose. Here’s an overview of what each sheet offers:
Dashboard Sheet Tab
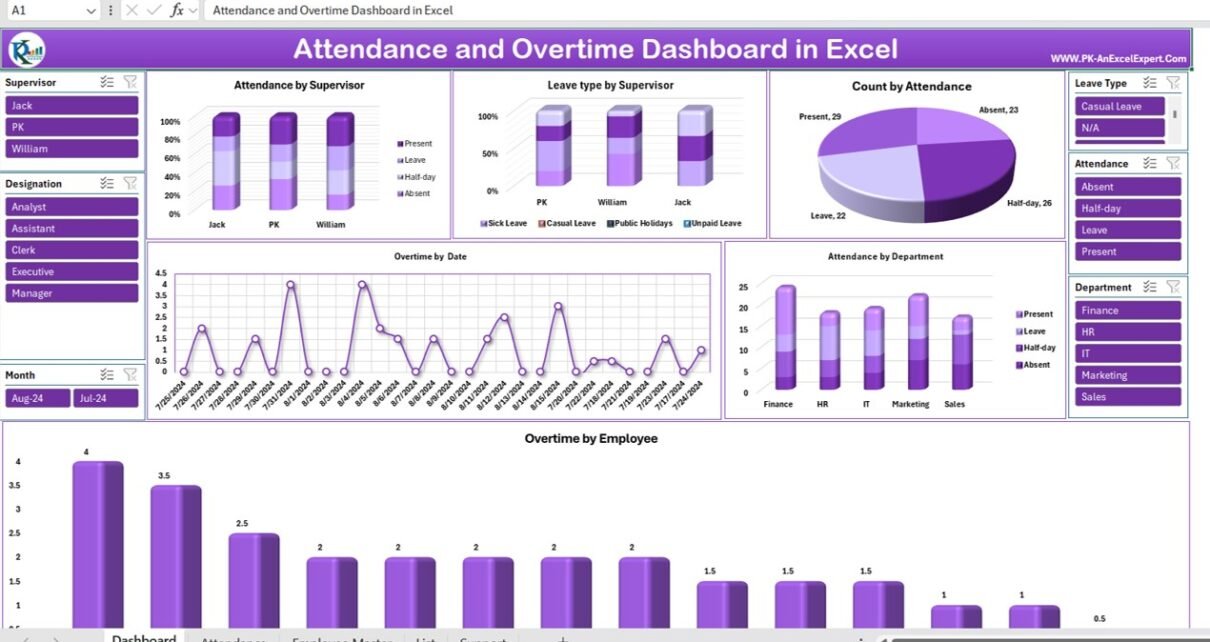
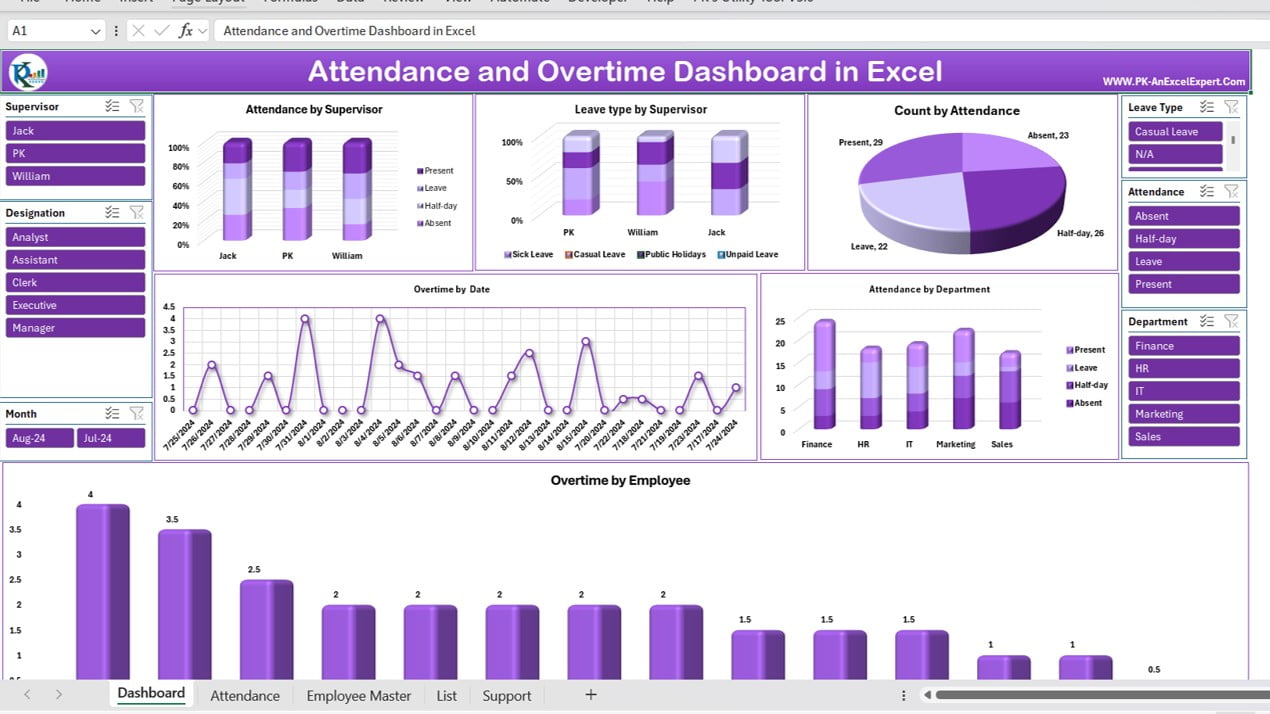
The Dashboard Sheet is the heart of this tool, where all the data is visually represented through multiple charts and slicers. The top section of this sheet includes several dynamic charts:
Click to buy Attendance and Overtime Dashboard in Excel
- Attendance by Supervisor: A column chart displaying the status of employees—Present, On Leave, Half-day, and Absent—grouped by their supervisors.
- Leave Type by Supervisor: Another column chart that categorizes the types of leaves (Sick Leave, Casual Leave, Public Holidays, Unpaid Leave) taken by employees, organized by their respective supervisors.
- Count by Attendance: A 3D pie chart providing a quick snapshot of the overall attendance status across the organization—Present, On Leave, Half-day, and Absent.
- Overtime by Date: A line chart that tracks overtime hours, helping to identify patterns and trends over time.
- Attendance by Department: This column chart breaks down attendance data by departments such as Finance, HR, IT, Marketing, and Sales, offering insights into departmental attendance trends.
Slicers for Interactive Analysis
The Dashboard features several slicers for interactive data filtering:
- Supervisor: Filter attendance data based on specific supervisors.
- Designation: Analyse attendance and overtime by different employee roles.
- Leave Type: Focus on specific types of leave to see their impact on overall attendance.
- Attendance: Toggle between various attendance statuses.
- Department: Narrow down the data to specific departments for a focused analysis.
- Month: View data month-by-month for seasonal or monthly trend analysis.
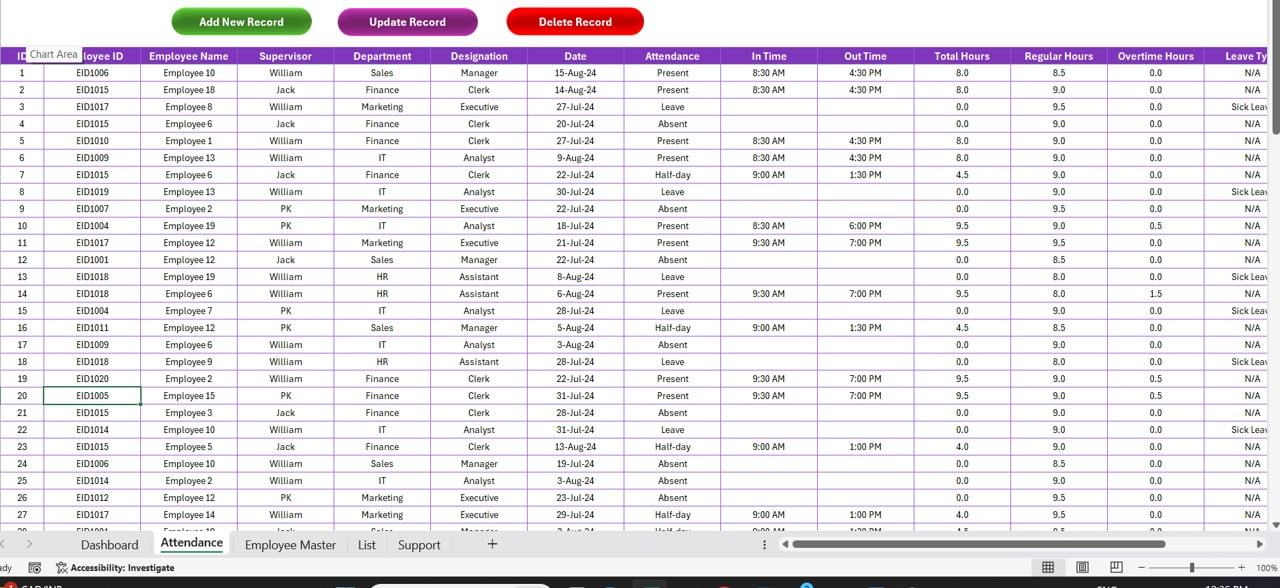
Attendance Sheet
This is the primary data entry sheet where attendance records are maintained. We have added a data entry form to enter the attendance data. We have given button to maintain the attendance data-
Click to buy Attendance and Overtime Dashboard in Excel
- Add New Record: This will open a Data entry form to add a new record.
- Update Record: Using this button you can modify existing records as needed.
- Delete Record: Remove outdated or incorrect records.
It includes the following columns:
ID, Employee ID, Employee Name, Supervisor, Department, Designation, Date, Attendance, In Time, Out Time, Total Hours, Regular Hours, Overtime Hours, Leave Type, Remarks and Month
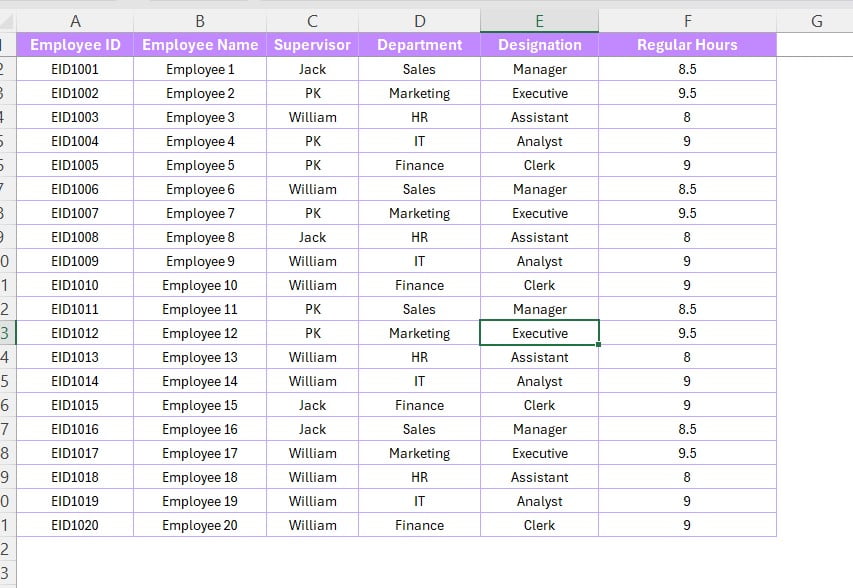
Employee Master Sheet
This sheet contains essential employee details, including:
Employee Master Sheet
Click to buy Attendance and Overtime Dashboard in Excel
- Employee ID: Unique identifier for each employee.
- Employee Name: The full name of the employee.
- Supervisor: The immediate supervisor of the employee.
- Department: The department in which the employee works.
- Designation: The employee’s job title.
- Regular Hours: The standard working hours expected from the employee.
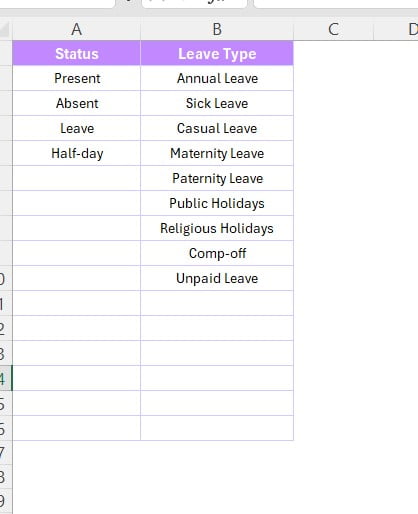
List Sheet
A simple sheet with two columns:
Click to buy Attendance and Overtime Dashboard in Excel
- Status: This is the Attendance status as Present, Absent or leave etc.
- Leave Type: Enumerates the different types of leaves available.
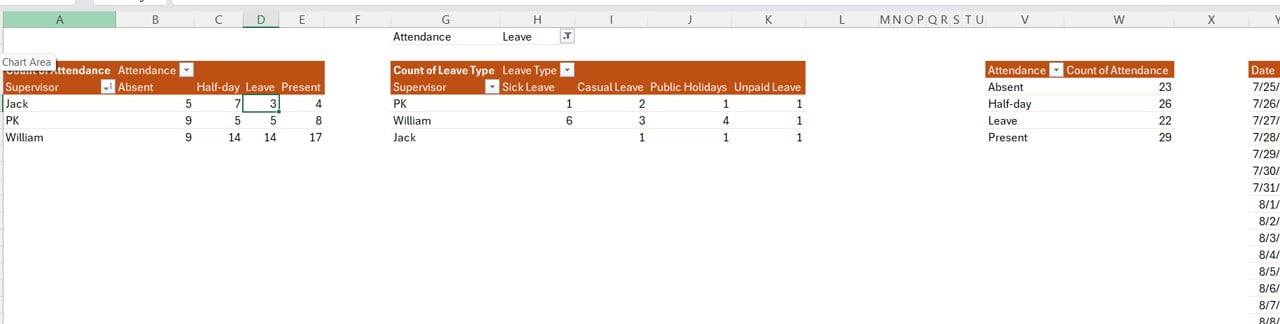
Support Sheet
Click to buy Attendance and Overtime Dashboard in Excel
This is a hidden sheet where pivot tables are created to drive the dashboard’s visualizations. These pivot tables are crucial for the dynamic nature of the charts and slicers on the Dashboard Sheet.
Advantages of the Attendance and Overtime Dashboard
Implementing this dashboard offers several benefits:
Enhanced Data Visualization
The dashboard transforms raw data into easy-to-understand visuals, making it simpler to identify patterns, trends, and anomalies in attendance and overtime records.
Improved Decision-Making
With real-time data at your fingertips, supervisors and HR professionals can make informed decisions regarding workforce management, such as identifying departments that require more resources or employees who are frequently absent.
Time-Efficient
Automating the attendance tracking process reduces manual data entry and calculations, saving valuable time for HR teams and managers.
Compliance and Accuracy
Maintaining accurate records of attendance and overtime ensures compliance with labour laws and company policies. This reduces the risk of legal issues and ensures fair payroll processing.
Customizable and Scalable
The template is designed to be flexible, allowing users to modify it according to their specific needs. It can easily be scaled as the organization grows.
Best Practices for Using the Attendance and Overtime Dashboard
To maximize the effectiveness of this tool, consider the following best practices:
Regular Data Updates
Ensure that attendance and overtime data are updated regularly. This keeps the dashboard accurate and reliable for decision-making.
Training for Users
Provide adequate training for those who will be using the dashboard. Understanding how to navigate the dashboard, use slicers, and interpret the charts is crucial for making the most out of the tool.
Customization to Fit Organizational Needs
Every organization is unique. Tailor the dashboard to reflect your specific attendance and overtime tracking requirements. For instance, you can add additional charts, modify existing ones, or integrate other relevant data.
Periodic Reviews
Schedule periodic reviews of the dashboard’s performance and relevance. As your organization evolves, so too should your tools. Regular reviews will help identify areas for improvement or adjustment.
Frequently Asked Questions (FAQs)
Q1: Can I use this dashboard for a small team or a large organization?
A1: Yes, the Attendance and Overtime Dashboard is scalable and can be customized to suit both small teams and large organizations. You can add or remove employees, departments, and other data points as needed.
Q2: Is it possible to track different types of leaves and overtime in this dashboard?
A2: Absolutely! The dashboard includes options to track various leave types and overtime hours. You can also filter this data by different criteria like department, supervisor, or month.
Q3: Can this dashboard be integrated with other software?
A3: While the dashboard is an Excel-based tool, it can potentially be integrated with other software through data imports and exports. However, full integration with HRMS or payroll systems would require additional customization.
Q4: How often should the data be updated?
A4: It’s recommended to update the data daily or weekly, depending on your organization’s needs. Regular updates ensure the accuracy of the dashboard and the insights it provides.
Q5: Can I modify the charts and slicers?
A5: Yes, the dashboard is fully customizable. You can modify existing charts and slicers, or add new ones to better suit your organizational needs.
Q6: Is this dashboard suitable for remote teams?
A6: Yes, the dashboard can be used to track attendance and overtime for both in-office and remote teams, provided that the necessary data is recorded accurately.
Conclusion
The Attendance and Overtime Dashboard in Excel is an invaluable tool for businesses looking to streamline their workforce management processes. Its comprehensive features, coupled with the ability to customize and scale, make it a versatile solution for tracking attendance and overtime. By following the best practices outlined above and considering opportunities for improvement, you can ensure that this tool provides maximum value to your organization.
If you have any questions or need further assistance with setting up the dashboard, feel free to reach out. This template is designed to empower you to manage your team’s attendance and overtime efficiently, enabling you to focus on what truly matters—growing your business.
Click to buy Attendance and Overtime Dashboard in Excel
Visit our YouTube channel to learn step-by-step video tutorials
Watch the step-by-step video tutorial:
Click to buy Attendance and Overtime Dashboard in Excel