In the fast-paced automotive industry, keeping track of key performance indicators (KPIs) is essential for success. Whether you’re managing production rates, sales, or customer satisfaction, a reliable Automotive KPI Dashboard in Excel can help streamline the process. This dashboard offers an easy and effective way to visualize performance data, compare results with targets, and make informed decisions that drive business growth.
In this article, we’ll take an in-depth look at how to create an Automotive KPI Dashboard in Excel. We will explore its key features, best practices, advantages, and opportunities for improvement. By the end of this guide, you’ll understand how to use this tool to optimize your business operations.
Click to buy Automotive KPI Dashboard in Excel
What Is an Automotive KPI Dashboard?
An Automotive KPI Dashboard is a visual tool that helps businesses monitor their key performance metrics in one place. This dashboard is specifically designed for the automotive sector, where tracking critical data like sales figures, production performance, and customer feedback is crucial. By using Excel, this dashboard can be fully customized to meet the unique needs of each business, allowing users to enter data, set targets, and visualize trends in real-time.
Let’s walk through the specific features of this dashboard and how each one can help your business.
Key Features of the Automotive KPI Dashboard
Click to buy Automotive KPI Dashboard in Excel
Our Automotive KPI Dashboard template comes with seven distinct worksheets, each serving a different purpose in tracking, managing, and analyzing performance. Here’s a breakdown of these features:
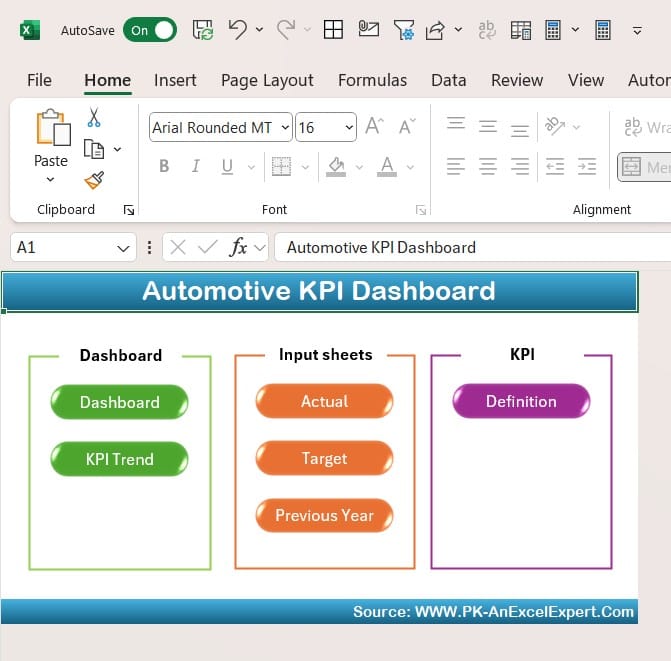
Home Sheet:
Click to buy Automotive KPI Dashboard in Excel
The Home Sheet acts as the control center for the entire dashboard. It includes six interactive buttons that allow users to quickly navigate between different sections of the dashboard.
- Why It Matters: This feature simplifies the user experience by providing a central hub for easy navigation, saving time and effort when switching between sheets.
Dashboard Sheet Tab:
Click to buy Automotive KPI Dashboard in Excel
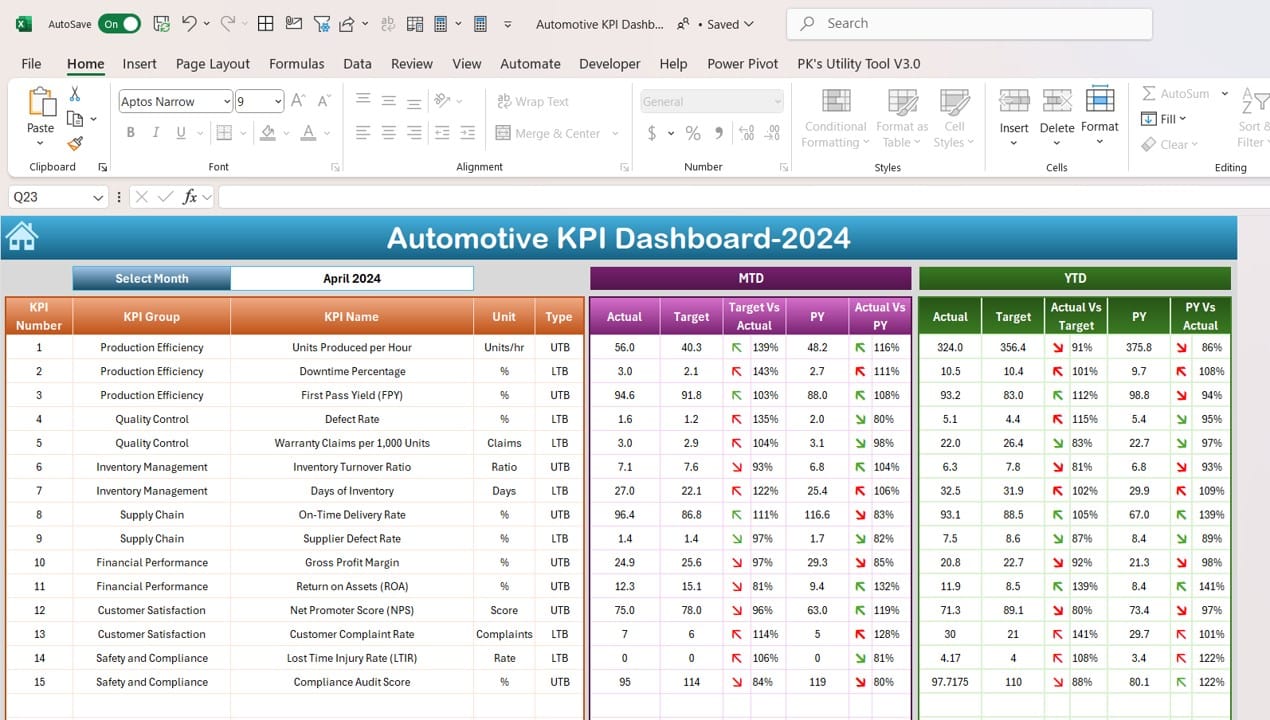
The Dashboard Sheet is where you will find all the essential KPI data for your business. It allows users to select a month from a drop-down menu in range D3, and the entire dashboard updates based on the selected month. The sheet provides:
- MTD (Month-to-Date) Actual, Target, and Previous Year data: Easily track how your KPIs are performing this month compared to last year and the current targets.
- Conditional Formatting: Arrows highlight whether performance is improving or declining based on set targets and previous year data.
- YTD (Year-to-Date) Actual, Target, and Previous Year data: Similarly, you can track the year-to-date numbers for a broader performance overview.
- Why It Matters: This is the primary sheet where you can view all relevant performance data at a glance, providing quick insights into how the business is performing both on a monthly and yearly basis.
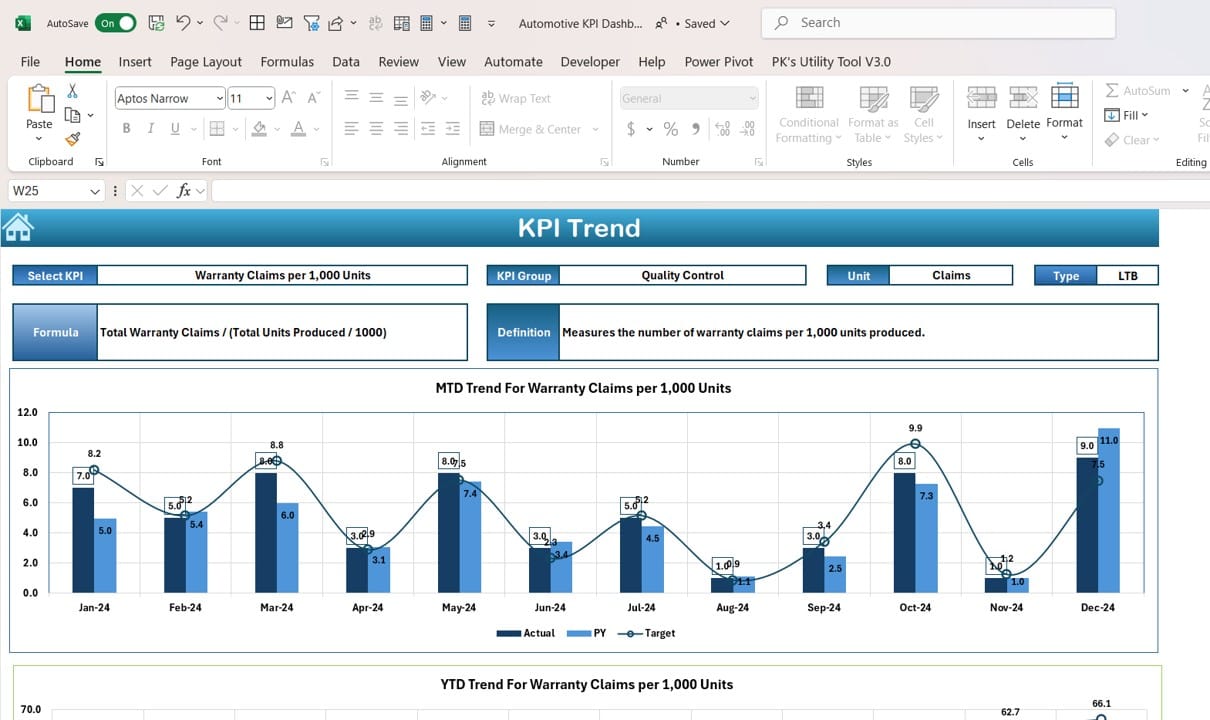
KPI Trend Sheet Tab:
Click to buy Automotive KPI Dashboard in Excel
The KPI Trend Sheet offers detailed insights into each KPI’s performance. Users can select a KPI from the drop-down menu in range C3, and the sheet will display the following:
- KPI Group, Unit, and Formula: Understand the KPI’s grouping, how it is measured, and the formula used to calculate it.
- KPI Type: Know whether a lower or higher value is better for this specific KPI.
- MTD and YTD Trend Charts: Visualize the KPI’s performance over time with trend charts showing actual, target, and previous year data.
- Why It Matters: This sheet helps users understand long-term trends for each KPI, which is essential for identifying areas that need attention or improvement.
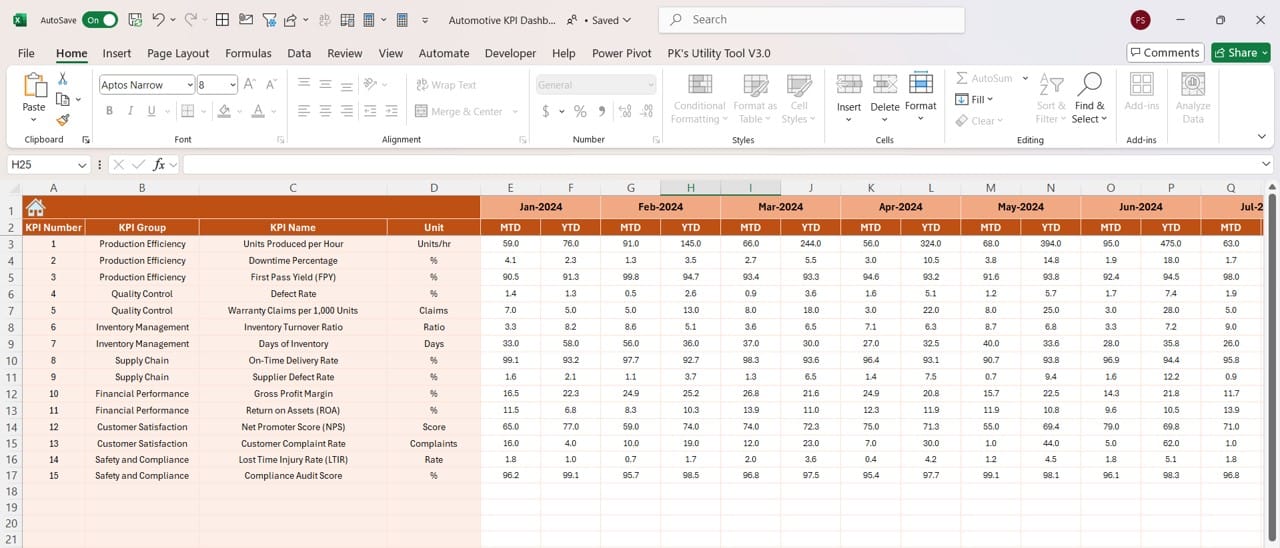
Actual Numbers Input Sheet:
Click to buy Automotive KPI Dashboard in Excel
The Actual Numbers Input Sheet is where users input the actual performance data for both month-to-date (MTD) and year-to-date (YTD) metrics. You can select the month for which you’re entering data by updating range E1.
- Why It Matters: Accurate data entry is crucial for the dashboard to function properly. This sheet ensures that all performance data is up-to-date and available for analysis in the main dashboard.
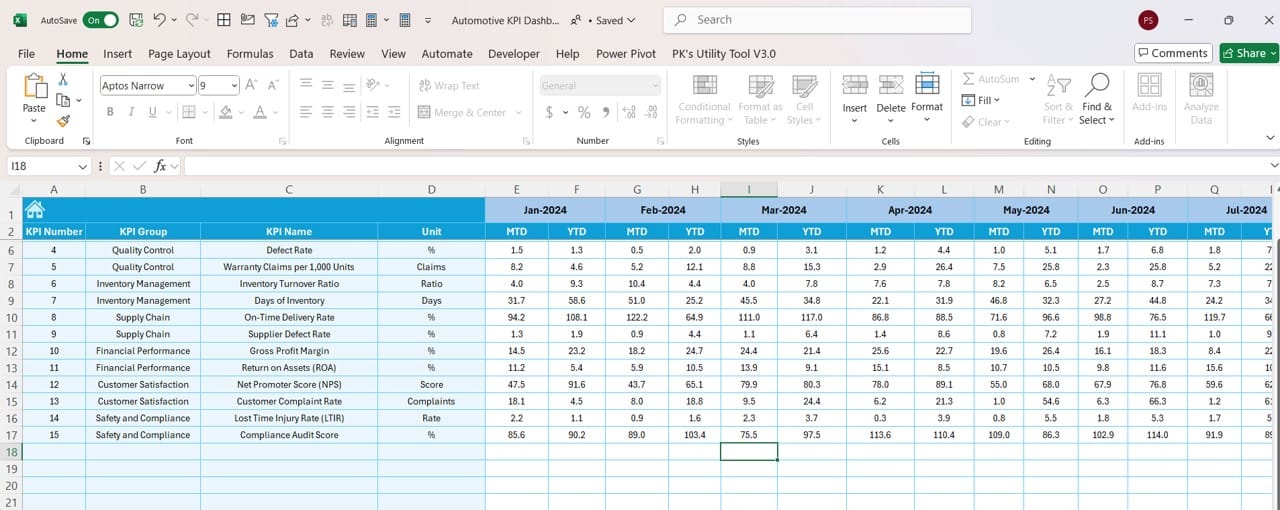
Target Sheet Tab:
Click to buy Automotive KPI Dashboard in Excel
In the Target Sheet Tab, users enter the target numbers for each KPI, both for MTD and YTD. These target numbers are critical for comparing actual performance against desired outcomes.
- Why It Matters: Setting clear targets is essential for measuring performance. This sheet allows users to define their goals, making it easier to see if the business is on track or falling behind.
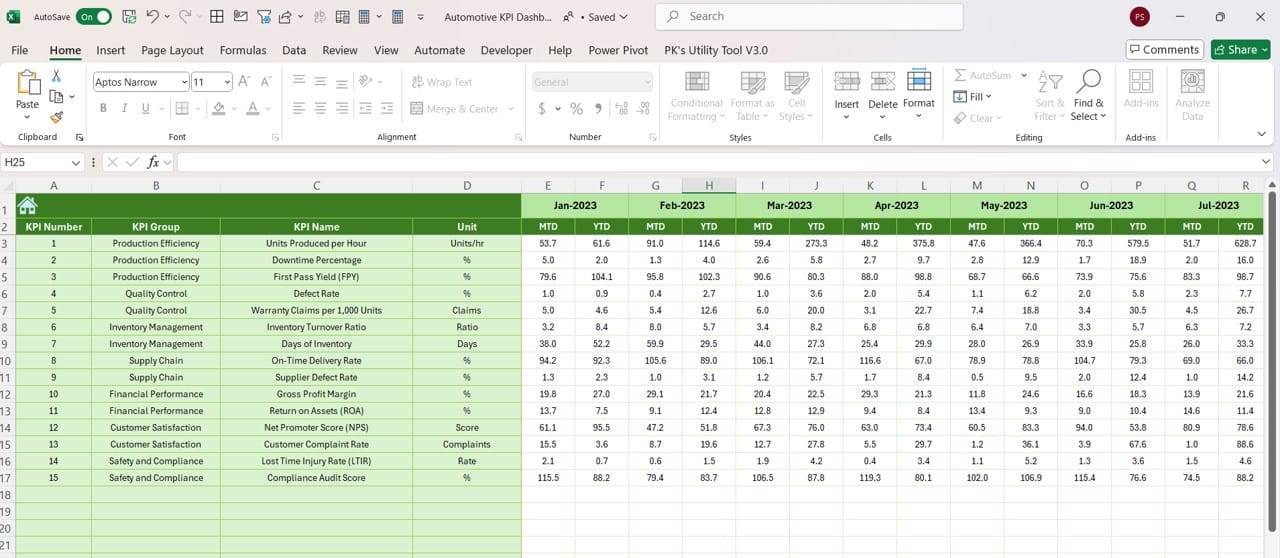
Previous Year Numbers Sheet:
Click to buy Automotive KPI Dashboard in Excel
This sheet allows users to input the previous year’s performance data. It mirrors the Actual Numbers Input sheet but focuses on the prior year’s figures. Entering this data enables year-over-year comparisons, a vital metric for tracking growth.
- Why It Matters: Year-over-year comparisons provide valuable context, helping businesses see how much progress has been made or where things have slowed down.
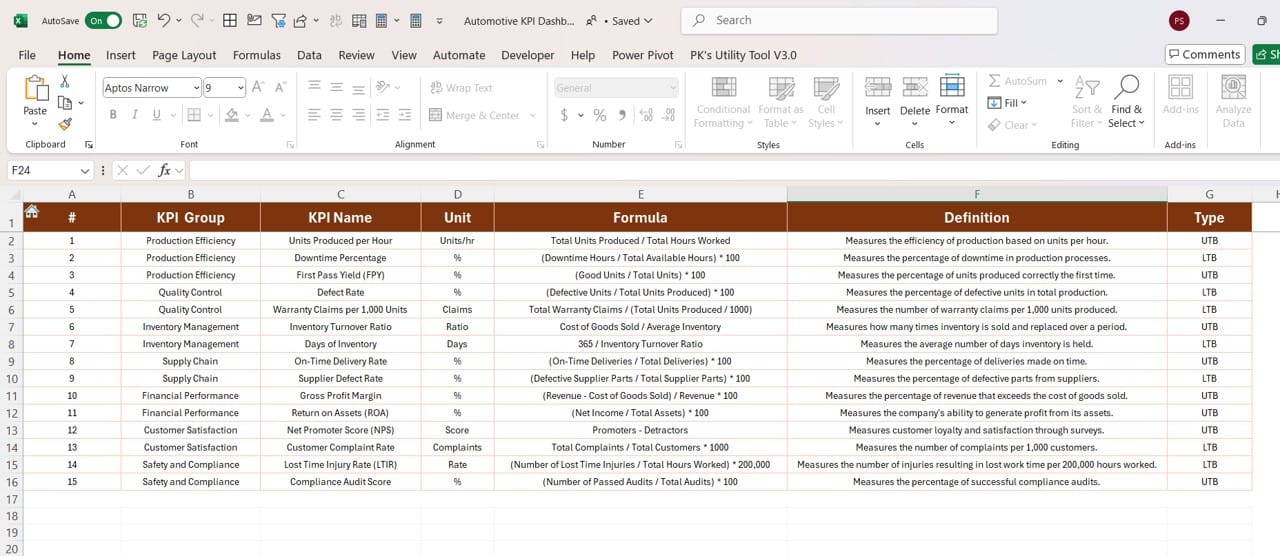
KPI Definition Sheet:
Click to buy Automotive KPI Dashboard in Excel
In the KPI Definition Sheet, users define each KPI’s name, group, unit, formula, and meaning. This sheet serves as a reference guide for all the KPIs used in the dashboard.
- Why It Matters: Understanding what each KPI measures and how it is calculated ensures that all users are on the same page when analyzing data.
Advantages of Using an Automotive KPI Dashboard
Using an Automotive KPI Dashboard offers many benefits to automotive businesses. Here are some of the most important advantages:
- Real-Time Data Tracking: The dashboard allows you to visualize data in real-time, so you’re always aware of your business’s current performance.
- Improved Decision-Making: By comparing actual performance with targets and previous years, managers can make informed decisions faster.
- Increased Efficiency: With automated data tracking and easy-to-read charts, the dashboard eliminates the need for manual reporting, freeing up time for analysis.
Best Practices for Using an Automotive KPI Dashboard
To get the most out of your Automotive KPI Dashboard, consider these best practices:
- Regular Data Updates: Ensure that you regularly input accurate data to keep the dashboard up to date.
- Customizable Metrics: Adapt the dashboard to suit your specific needs by modifying KPI groups and adding new metrics where necessary.
- Realistic Target Setting: Set achievable but challenging targets to maintain a balance between motivation and attainability.
Click to buy Automotive KPI Dashboard in Excel
Opportunities for Improvement in Automotive KPI Dashboards
While an Automotive KPI Dashboard offers many advantages, there are still opportunities to improve its functionality:
- Automating Data Input: Integrating your dashboard with real-time data sources like your ERP system can make data input fully automatic.
- Enhanced Visualizations: Adding more visual elements, such as sparklines or pie charts, could provide a more comprehensive view of performance trends.
- Training for Users: Ensuring that all team members are well-versed in how to use the dashboard will make it more effective for business-wide use.
Conclusion
An Automotive KPI Dashboard in Excel is an indispensable tool for any automotive business looking to streamline its performance tracking. By providing real-time, visual insights into key performance metrics, this dashboard helps decision-makers stay informed and respond proactively to performance trends. With its customizable features and easy-to-use design, it’s a powerful resource that can be adapted to suit any automotive business.
Click to buy Automotive KPI Dashboard in Excel
Frequently Asked Questions (FAQs)
Q. What are KPIs in the automotive industry?
KPIs, or Key Performance Indicators, are measurable values that reflect the success of different aspects of an automotive business. Examples include sales performance, production efficiency, and customer satisfaction.
Q. How can I create an Automotive KPI Dashboard in Excel?
You can create an Automotive KPI Dashboard by defining your key metrics, setting up data input sheets for actual and target numbers, and using Excel formulas and charts to visualize your performance data.
Q. Can I customize the KPIs in the dashboard?
Yes, the dashboard is fully customizable. You can add new KPIs, modify the grouping of KPIs, and adjust the formulas used to calculate performance.
Q. How often should I update the data in my dashboard?
It’s best to update your dashboard monthly to reflect current MTD and YTD performance. However, weekly updates can offer even more timely insights into your business’s performance.
Click to buy Automotive KPI Dashboard in Excel
By following this guide, you can create an effective Automotive KPI Dashboard that will keep your business on track and ahead of the competition.
Visit our YouTube channel to learn step-by-step video tutorials
View this post on Instagram
Click to buy Automotive KPI Dashboard in Excel