Blockchain & Cryptocurrency KPI Dashboard have revolutionized financial transactions, investment strategies, and data security. To effectively monitor and analyze Blockchain & Cryptocurrency KPI Dashboard performance, a well-structured KPI dashboard is essential. Power BI, a robust business intelligence tool, provides an interactive and dynamic environment to visualize and manage blockchain-related KPIs efficiently.
This article explores a Blockchain & Cryptocurrency KPI Dashboard in Power BI, detailing its features, benefits, best practices, and frequently asked questions.
Click to Blockchain & Cryptocurrency KPI
What is a Blockchain & Cryptocurrency KPI Dashboard?
A Blockchain & Cryptocurrency KPI Dashboard is a visual representation of key performance indicators related to blockchain and cryptocurrency operations. It enables businesses, investors, and analysts to monitor essential metrics such as transaction volume, market capitalization, and security efficiency.
Key Features of the Blockchain & Cryptocurrency KPI Dashboard
This Blockchain & Cryptocurrency KPI Dashboard consists of three primary pages:
Summary Page
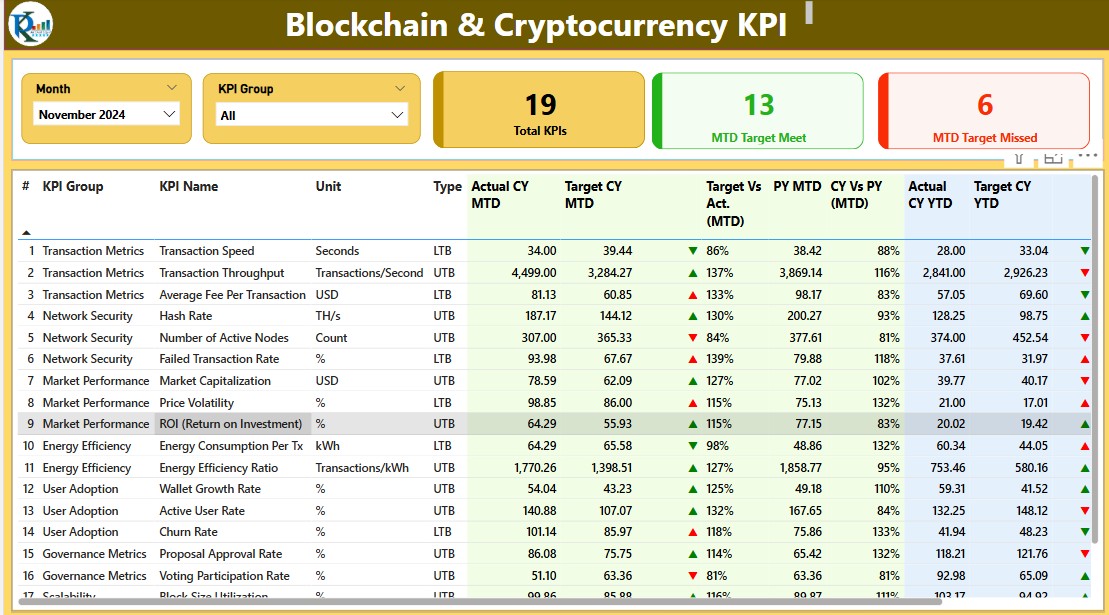
The Summary Page is the main dashboard interface that presents key performance indicators concisely.
- Filters & Slicers: Users can filter data based on Month and KPI Group.
- KPI Cards: Three summary cards display the following:
Total KPIs Count
- MTD (Month-to-Date) Target Met Count
Click to Blockchain & Cryptocurrency KPI
MTD Target Missed Count
- Detailed KPI Table: Displays critical KPI metrics, including:
- KPI Number – The sequence number of each KPI.
- KPI Group – The category of the KPI (e.g., Transactions, Security, Market Analysis).
- KPI Name – The specific metric being measured.
- Unit – Measurement unit (e.g., USD, BTC, Percentage).
- Type – Defines whether the KPI follows the Lower the Better (LTB) or Upper the Better (UTB) approach.
- Actual CY MTD & Target CY MTD – Displays current year and target Month-to-Date values.
- MTD Status Icon – Uses ▲ (Green) for met targets and ▼ (Red) for missed targets.
- Target vs Actual (MTD) – Percentage of target achievement.
- PY MTD & CY vs PY (MTD) – Compares performance with the previous year.
- Actual CY YTD & Target CY YTD – Shows Year-to-Date actual and target numbers.
- YTD Status Icon – ▲ (Green) for met targets and ▼ (Red) for missed targets.
- Target vs Actual (YTD) – YTD target achievement percentage.
- PY YTD & CY vs PY (YTD) – Year-over-year comparison.
KPI Trend Page
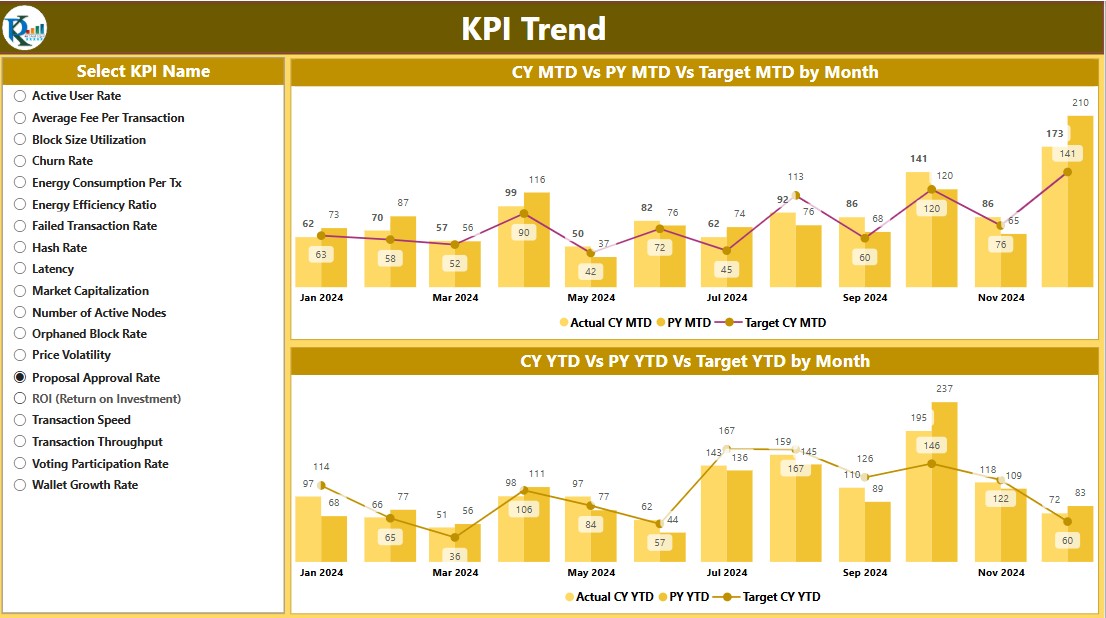
This page provides trend analysis using combo charts to display KPI performance over time.
- Charts: Show comparisons of Current Year (CY), Previous Year (PY), and Target values for both MTD and YTD.
- Filters: A slicer allows users to select specific KPIs for a detailed view.
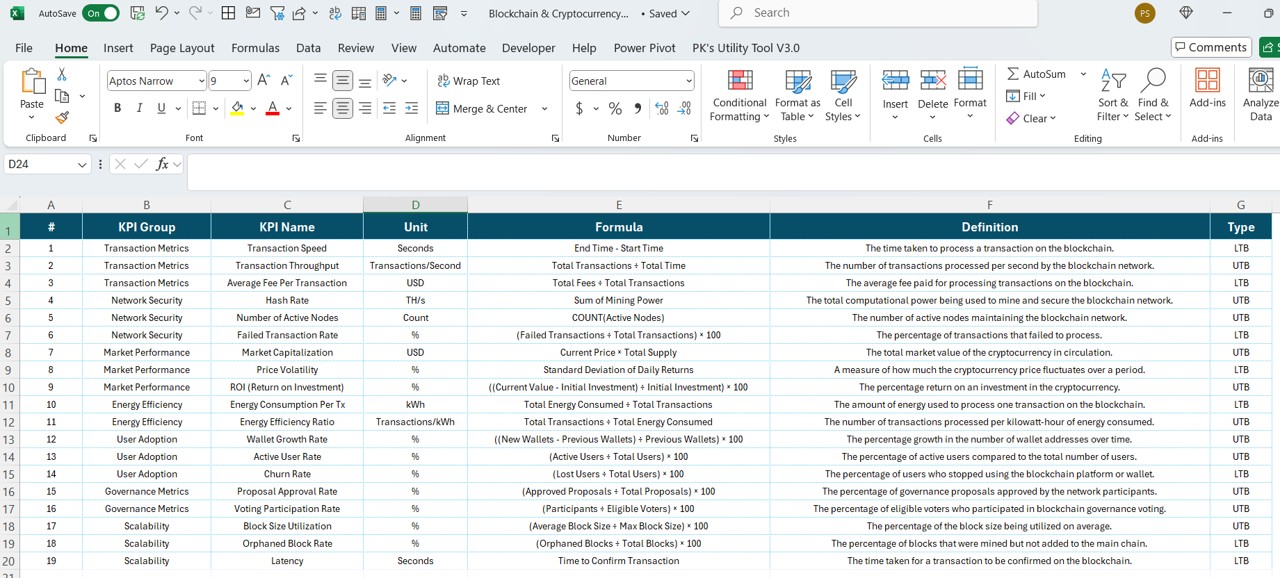
KPI Definition Page
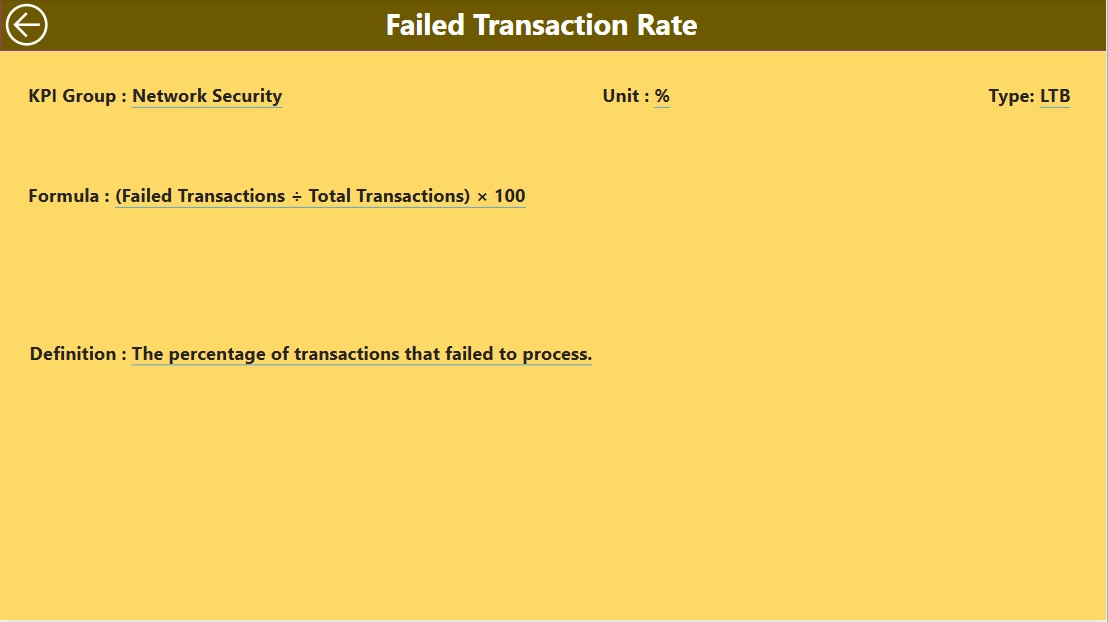
The KPI Definition Page provides a detailed breakdown of each KPI:
KPI Name & Number
- Formula – How the KPI is calculated.
- Definition – A detailed explanation of the KPI.
- Type (LTB/UTB) – Specifies the KPI evaluation type.
This page is a drill-through page hidden by default but can be accessed from the Summary Page.
Click to Blockchain & Cryptocurrency KPI
Data Source & Input Data Structure
This dashboard pulls data from an Excel file structured with three worksheets:
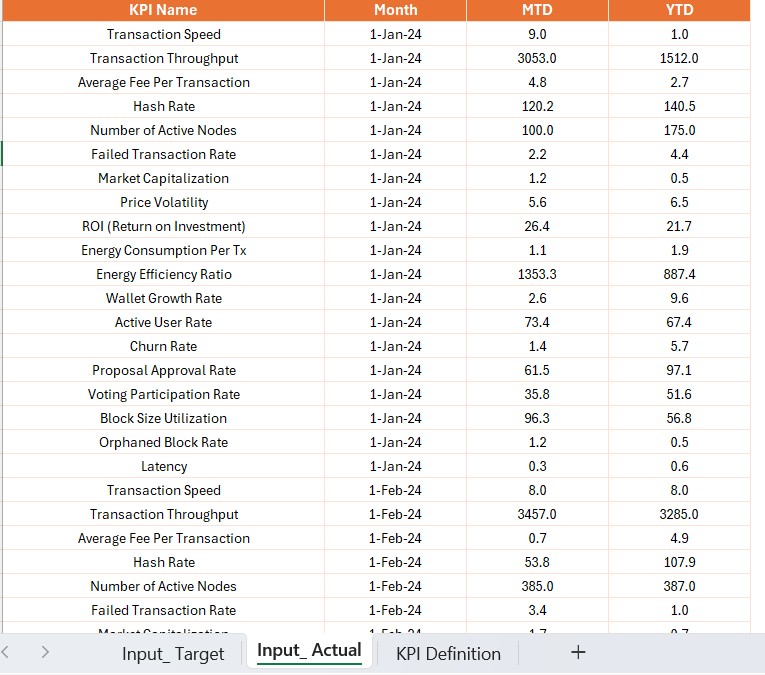
Input Actual Sheet:
- Enter actual values for each KPI, including:
- KPI Name
- Month (First date of the month)
- MTD & YTD numbers
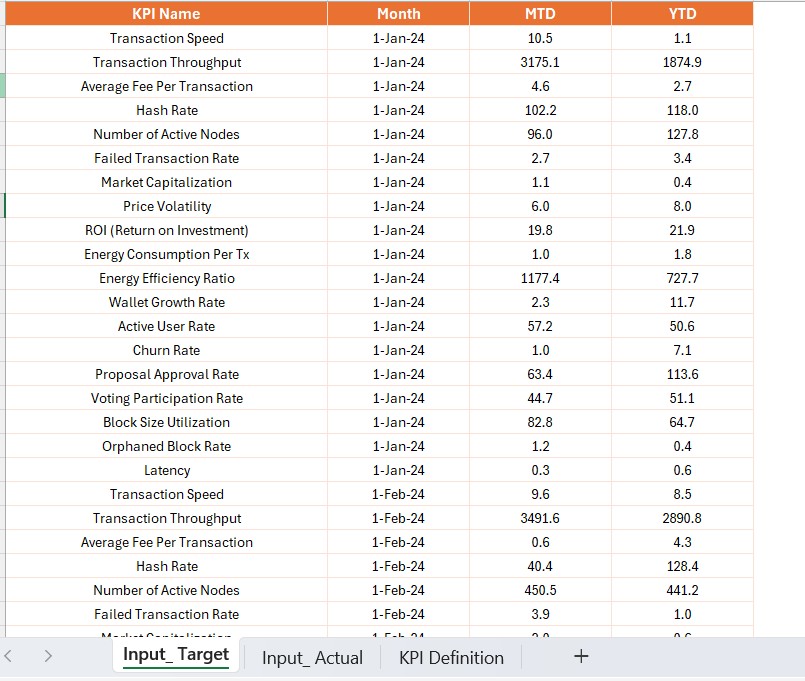
Input Target Sheet:
- Enter target values for each KPI.
KPI Definition Sheet:
- Define each KPI with:
- KPI Number, Group, Name, Unit, Formula, Definition, and Type (LTB or UTB).
Advantages of Using a Blockchain & Cryptocurrency KPI Dashboard
- Real-Time Data Monitoring: The dashboard enables live tracking of blockchain and cryptocurrency KPIs.
- Data-Driven Decision Making: With visual analytics, businesses can make informed investment and security decisions.
- Performance Benchmarking: The comparison between Current Year and Previous Year KPIs helps in identifying growth patterns.
- Improved Accuracy: The structured input sheets reduce the chances of errors in KPI calculations.
- Enhanced Visualization: Interactive charts and tables present complex data in an easy-to-understand format.
Click to Blockchain & Cryptocurrency KPI
Best Practices for Using the KPI Dashboard
- Regular Data Updates: Ensure that input sheets are updated regularly for accurate KPI tracking.
- Utilize Filters for Deep Analysis: Use slicers to filter data by KPI group and month for better insights.
- Leverage Drill-Through for Detailed Analysis: Use the KPI Definition Page to understand complex KPIs in detail.
- Monitor KPI Trends: Keep an eye on KPI trends using MTD and YTD charts.
- Ensure Data Accuracy: Double-check formulas in Excel input sheets before loading data into Power BI.
Conclusion
A Blockchain & Cryptocurrency KPI Dashboard in Power BI provides businesses, investors, and analysts with a powerful tool to track, analyze, and optimize blockchain-related KPIs. With real-time tracking, detailed KPI breakdowns, and trend analysis, it enhances decision-making and strategic planning. By following best practices and updating data regularly, users can maximize the potential of this KPI dashboard.
Frequently Asked Questions (FAQs)
What are the key benefits of using a Power BI KPI Dashboard for blockchain and cryptocurrency?
- Real-time tracking of KPIs.
- Data visualization for better decision-making.
- Historical data comparison for benchmarking.
How frequently should I update my KPI data in Power BI?
- It is recommended to update data weekly or monthly, depending on the business requirements.
Can I customize the KPI Dashboard?
Yes, Power BI allows customization of charts, tables, and filters based on specific needs.
How does the KPI Trend page help in decision-making?
It provides historical data comparisons to track KPI improvements and deviations over time.
Click to Blockchain & Cryptocurrency KPI
Visit our YouTube channel to learn step-by-step video tutorials
View this post on Instagram