Brand awareness is essential for any business aiming to make a significant impact in the market. It represents how familiar potential customers are with your brand, product, or service. A higher brand awareness generally leads to more customer trust, higher sales, and greater market share. To measure and optimize brand awareness, businesses can use a Brand Awareness KPI Dashboard. This powerful tool helps track critical Key Performance Indicators (KPIs) related to brand visibility and reach, providing real-time insights that allow businesses to enhance their marketing strategies.
In this article, we will explore the essential KPIs for a Brand Awareness KPI Dashboard, including their units, aggregation formulas, definitions, and whether a higher or lower value is desirable. We will also cover the dashboard’s key features, best practices, opportunities for improvement, and answer common questions related to brand awareness KPIs.
What is a Brand Awareness KPI Dashboard?
A Brand Awareness KPI Dashboard is a visual tool used to track and evaluate the effectiveness of branding efforts. It compiles several KPIs that provide insights into how well your brand is reaching its target audience and how it is being perceived. These KPIs measure various aspects such as engagement, visibility, sentiment, and recall. By analyzing these metrics, businesses can adjust their strategies to improve brand recognition and strengthen their presence in the market.
The Brand Awareness KPI Dashboard offers a comprehensive and streamlined view of all key metrics in one place. It helps businesses assess their performance, identify trends, and take proactive steps to enhance their brand awareness campaigns.
Key Features of the Brand Awareness KPI Dashboard
The Brand Awareness KPI Dashboard includes seven key worksheets that serve distinct functions. Below are the key features of this dashboard:
1. Home Sheet
The Home Sheet serves as the central hub of the dashboard. It includes six navigation buttons that allow users to jump to different sections of the dashboard. This ensures quick and easy access to all data.

Click to buy Brand Awareness KPI Dashboard in Excel
2. Dashboard Sheet Tab
The Dashboard Sheet is the primary tab where all KPIs are displayed in a visual format. The user can select a specific month from the drop-down list (Range D3), and the dashboard will automatically update to show the selected month’s data. This sheet displays:
- MTD (Month-to-Date) Actual vs. Target performance
- YTD (Year-to-Date) Actual vs. Target performance
- Target vs. Actual comparison with arrows indicating performance trends (up or down)
- Previous Year (PY) comparison to evaluate year-over-year performance

Click to buy Brand Awareness KPI Dashboard in Excel
3. KPI Trend Sheet Tab
This sheet allows users to select the KPI name from a drop-down menu (Range C3). It displays:
- KPI Group
- Unit of Measurement
- KPI Type (whether “Lower the Better” or “Upper the Better”)
- Formula used to calculate the KPI
- Definition of the KPI

Click to buy Brand Awareness KPI Dashboard in Excel
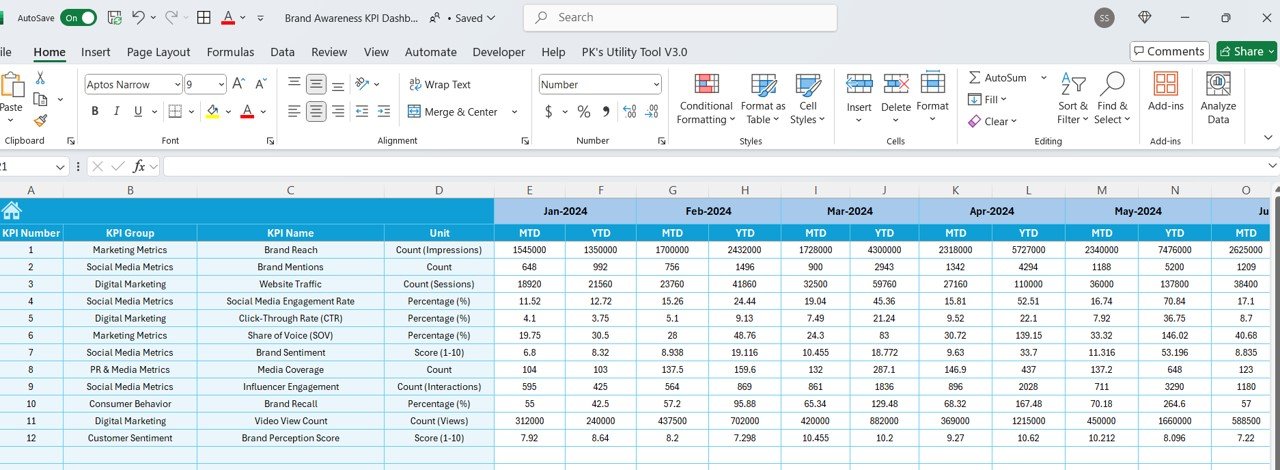
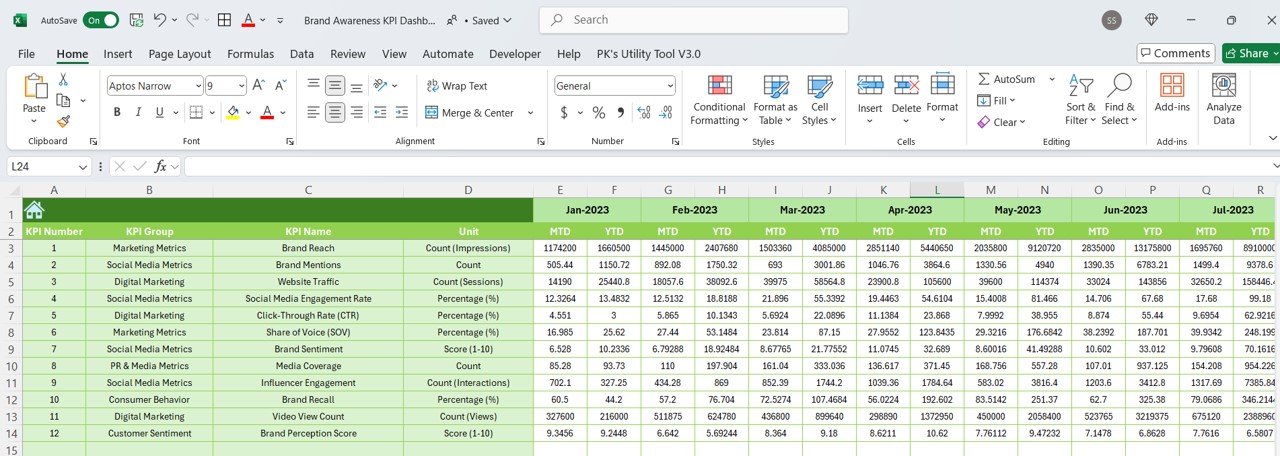
4. Actual Numbers Sheet Tab
This tab allows users to enter actual data for both YTD and MTD. By changing the month in Range E1, businesses can view the updated data for the selected month.

Click to buy Brand Awareness KPI Dashboard in Excel
5. Target Sheet Tab
This sheet allows businesses to enter the target values for each KPI, both for MTD and YTD. It enables comparison between actual and target performance.
Click to buy Brand Awareness KPI Dashboard in Excel
6. Previous Year Numbers Sheet Tab
In this sheet, users enter the corresponding data from the previous year. This allows for year-over-year comparisons to identify trends and assess the success of brand awareness efforts over time.
Click to buy Brand Awareness KPI Dashboard in Excel
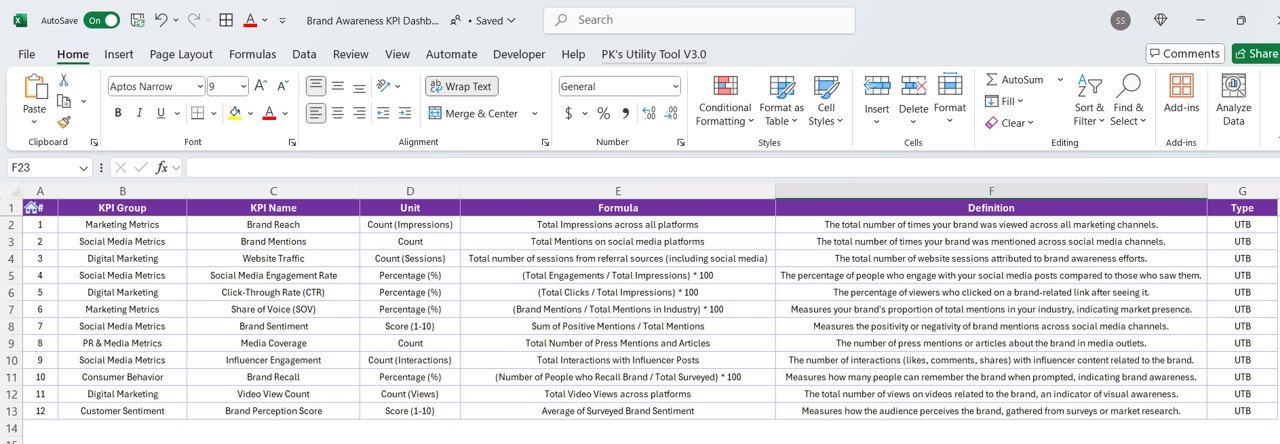
7. KPI Definition Sheet Tab
This sheet provides detailed information about each KPI, including:
- KPI Name
- KPI Group
- Unit
- Formula
- Definition
Click to buy Brand Awareness KPI Dashboard in Excel
Advantages of a Brand Awareness KPI Dashboard
Using a Brand Awareness KPI Dashboard offers several advantages that help businesses improve their marketing efforts:
- Real-Time Monitoring: The dashboard allows businesses to instantly track brand awareness metrics and adjust strategies as needed for continuous improvement.
- Data-Driven Decision Making: With all key performance data consolidated in one dashboard, businesses can make informed decisions and enhance marketing strategies effectively.
- Improved Marketing ROI: By tracking KPIs like impressions, engagement rates, and sentiment, businesses can ensure their marketing efforts yield the best possible return on investment.
Opportunity for Improvement in Brand Awareness KPI Dashboard
Despite its effectiveness, there are always opportunities to improve the Brand Awareness KPI Dashboard:
- Enhanced Data Visualization: Adding more interactive charts and graphs can help make the data more digestible and actionable, especially when presenting it to stakeholders.
- Integration with Social Media Metrics: Incorporating analytics from social media platforms can offer a more comprehensive picture of brand engagement and public perception.
- Automating Data Collection: By automating data entry from various marketing platforms, businesses can reduce manual errors and save time while ensuring data accuracy.
Best Practices for Using the Brand Awareness KPI Dashboard
To get the most out of the Brand Awareness KPI Dashboard, businesses should adhere to the following best practices:
- Set Clear Objectives: Establish clear goals for what you want to achieve with your brand awareness campaigns, ensuring that the KPIs you track align with those objectives.
- Update Data Regularly: Keep your dashboard up to date by frequently entering new data. This ensures that your analysis is based on the most recent performance.
- Engage the Team: Encourage all relevant team members to actively engage with the dashboard to make the most out of the insights it offers.
- Analyze Trends Over Time: Don’t focus solely on monthly data—reviewing long-term trends helps identify patterns and emerging opportunities for improvement.
- Use Conditional Formatting for Quick Insights: Leverage conditional formatting tools to highlight key performance areas, making it easier to identify issues that need attention.
Frequently Asked Questions (FAQs)
1. What KPIs should be included in the Brand Awareness KPI Dashboard?
The key KPIs include Brand Reach, Brand Mentions, Social Media Engagement Rate, Website Traffic, Click-Through Rate (CTR), and Brand Sentiment.
2. How is Brand Reach calculated?
Brand Reach is calculated by counting the total impressions across all marketing channels, including digital media, social media, and traditional media.
3. What does a high Brand Sentiment score indicate?
A high Brand Sentiment score indicates that people have a positive perception of the brand, which is important for fostering trust and loyalty.
4. How can I improve the Brand Recall?
Improving Brand Recall involves increasing brand visibility, creating memorable experiences, and ensuring that your brand consistently appears in front of your target audience.
5. Is it better to have a higher or lower Brand Perception Score?
A higher Brand Perception Score is better as it indicates a positive perception of your brand, which leads to increased brand loyalty and advocacy.
Conclusion
The Brand Awareness KPI Dashboard is an essential tool for businesses looking to measure, track, and optimize their branding efforts. By regularly monitoring key KPIs, businesses can identify areas for improvement, optimize marketing strategies, and achieve long-term success in building their brand presence. By making data-driven decisions based on the insights provided by the dashboard, businesses can effectively strengthen their brand awareness and remain competitive in the marketplace.
Visit our YouTube channel to learn step-by-step video tutorials
Click to buy Brand Awareness KPI Dashboard in Excel