
In today’s competitive business landscape, maintaining brand consistency is crucial for establishing credibility and trust with customers. A Brand Consistency KPI Dashboard in Excel helps businesses track and measure their brand performance over time. This article will provide a comprehensive guide on how to use this Excel-based KPI dashboard, its key features, advantages, and best practices to ensure effective brand management.
Click to Brand Consistency KPI
What is a Brand Consistency KPI Dashboard?
A Brand Consistency KPI Dashboard is a data-driven tool designed to monitor and analyze key performance indicators (KPIs) related to a brand’s consistency across various channels. It allows businesses to measure how well their branding efforts align with their goals and customer expectations.
Key Features of the Brand Consistency KPI Dashboard
This ready-to-use Excel template consists of seven worksheet tabs, each serving a unique purpose in managing brand consistency effectively:
Home Sheet
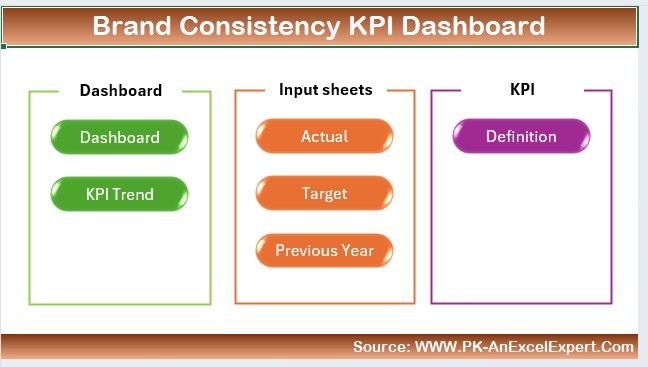
- Acts as an index page for easy navigation.
- Includes six clickable buttons to jump to respective sheets.
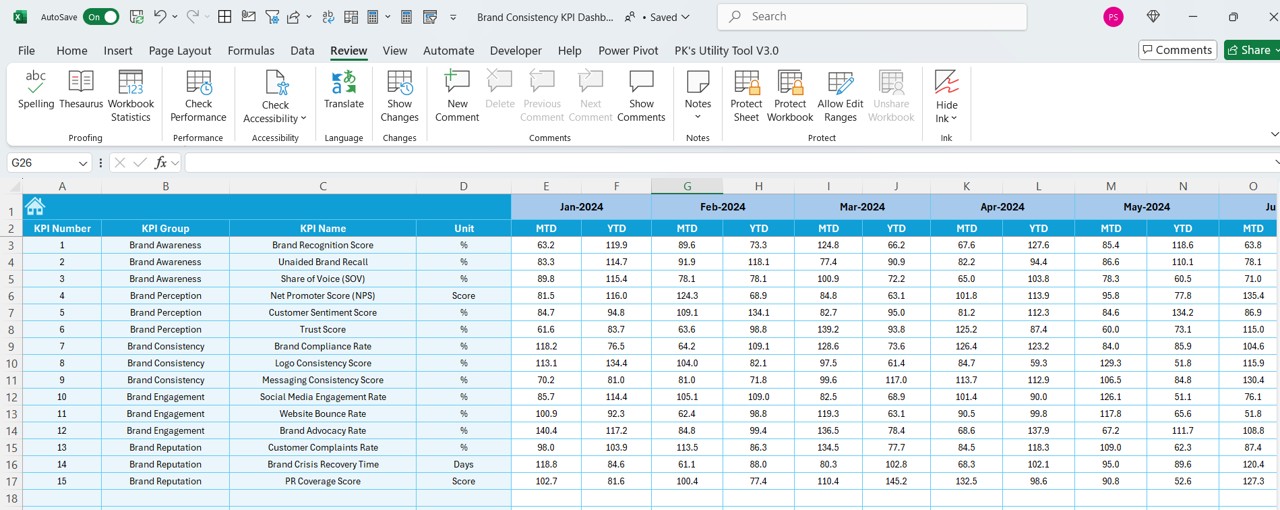
Dashboard Sheet
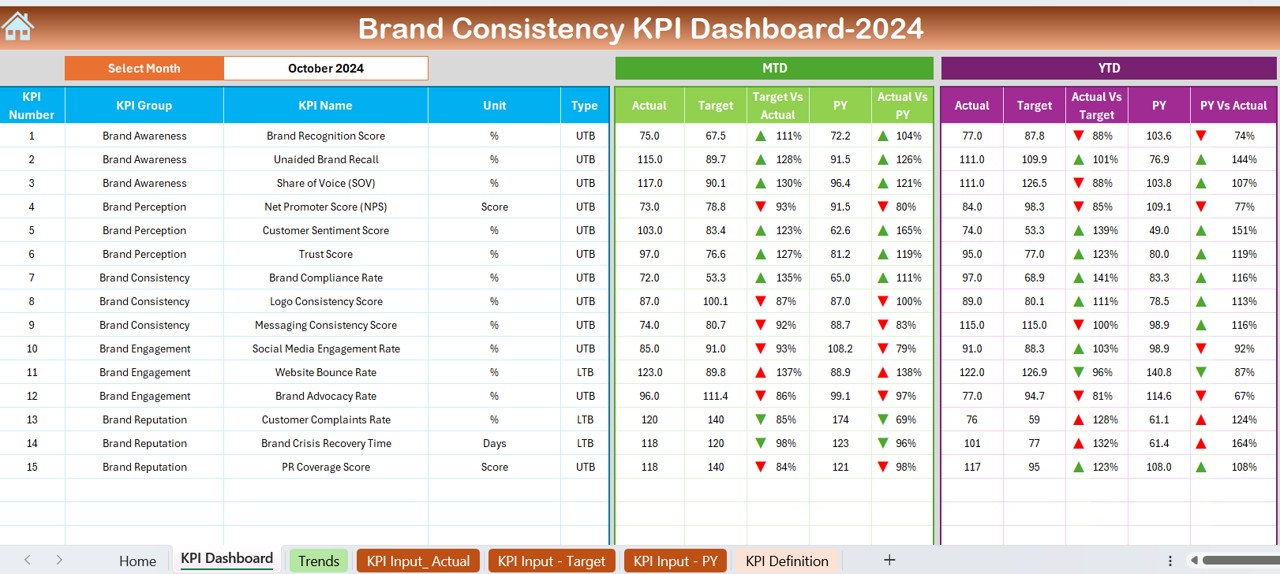
- The main hub for monitoring all KPIs.
- Allows users to select a month from a drop-down menu in cell D3.
- Displays MTD (Month-to-Date) and YTD (Year-to-Date) actual values, targets, and previous year data.
- Features conditional formatting with up/down arrows to highlight performance trends.
KPI Trend Sheet
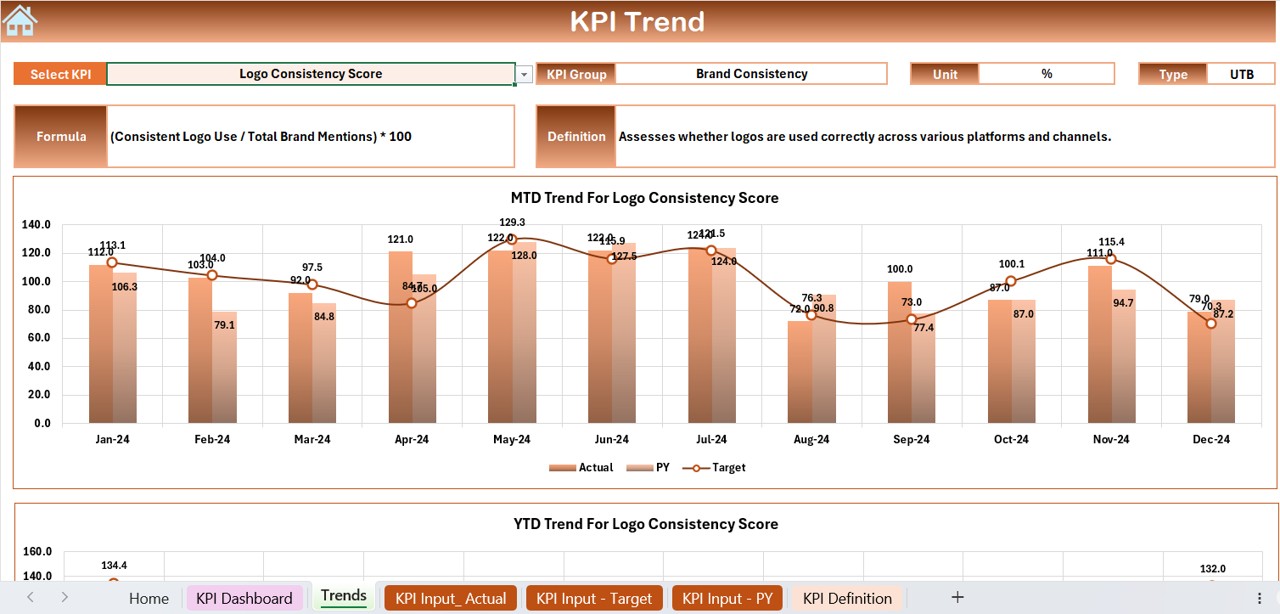
- Enables KPI selection via a drop-down in cell C3.
- Displays KPI group, unit, type (Lower the Better or Upper the Better), KPI formula, and definition.
- Provides trend charts for MTD and YTD comparisons.
Click to Brand Consistency KPI
Actual Numbers Input Sheet
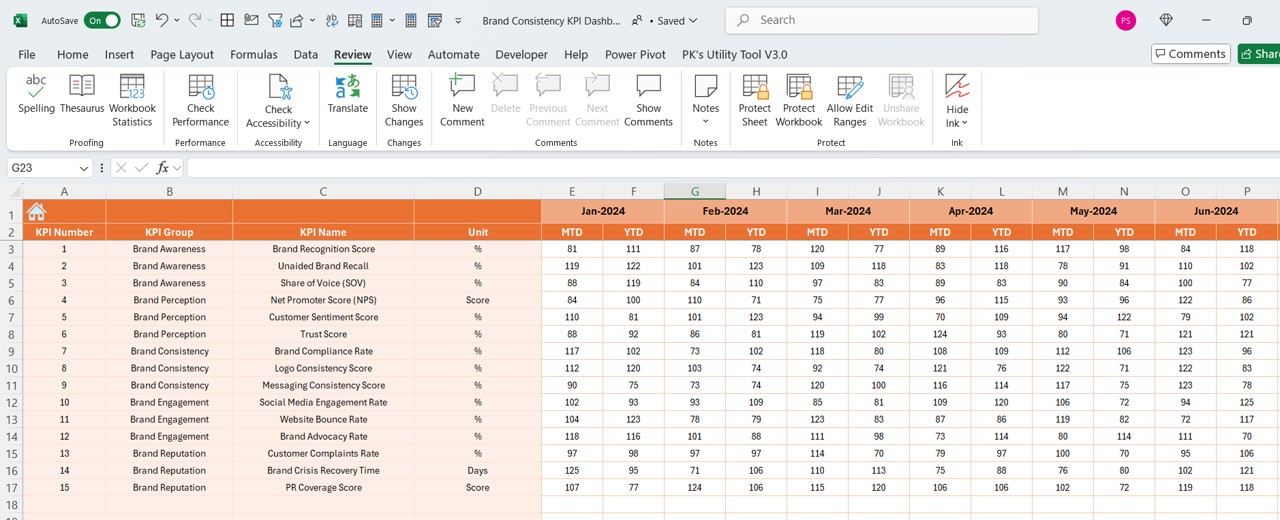
- Used for entering actual numbers for both MTD and YTD values.
- Users can change the reporting month by modifying cell E1.
Target Sheet
- Allows users to input monthly KPI targets for both MTD and YTD.
Previous Year Number Sheet
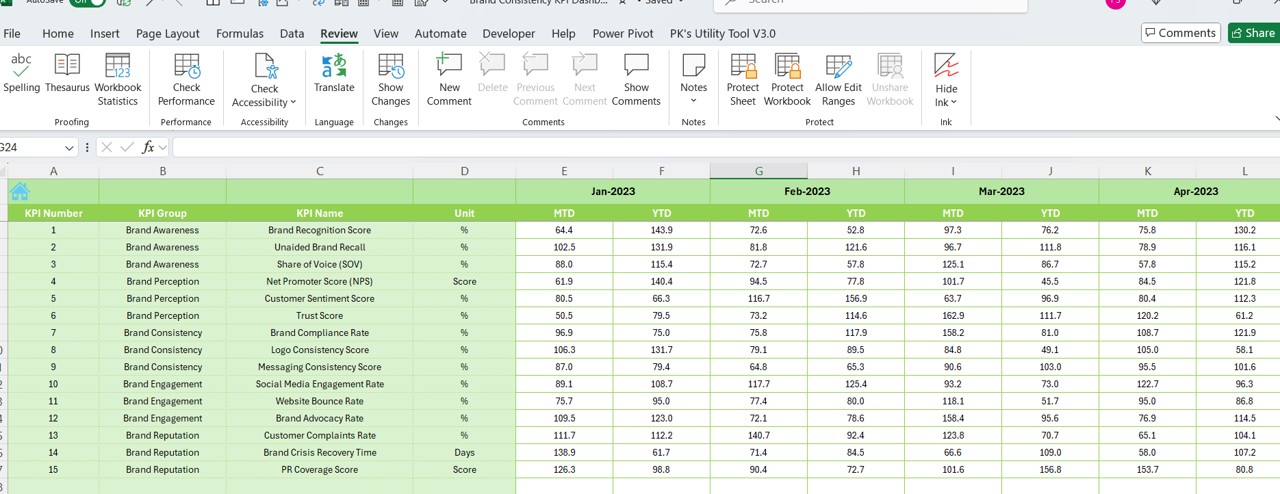
- Stores previous year’s data for historical comparisons.
KPI Definition Sheet
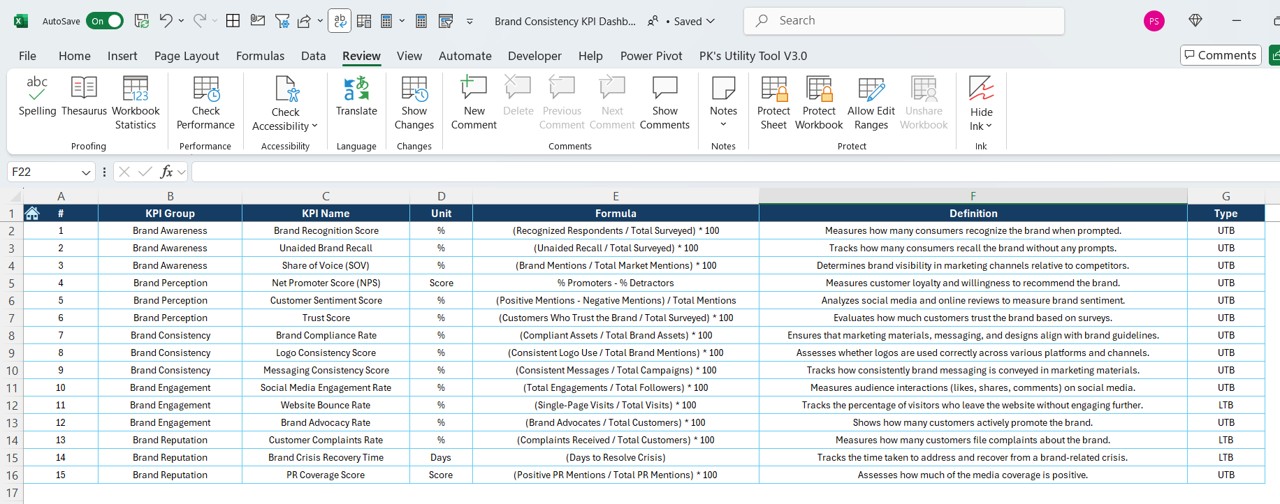
Contains all relevant details about KPIs, including:
- KPI Name
- KPI Group
- Unit of Measurement
- Formula
- Definition
Click to Brand Consistency KPI
Advantages of Using the Brand Consistency KPI Dashboard
📊 Real-time Monitoring: This dashboard provides up-to-date insights into brand performance metrics, allowing businesses to take corrective action when needed.
📈 Data-Driven Decision Making: With MTD and YTD trends, businesses can make informed decisions about their branding strategy.
🔄 Historical Comparisons: The inclusion of previous year data helps measure long-term brand consistency and track improvements.
🎯 Target vs. Actual Analysis: Conditional formatting and up/down arrows highlight areas where brand consistency is improving or needs improvement.
🚀 Easy Customization: Users can modify KPI formulas, add more KPIs, and adjust targets to suit their business needs.
Best Practices for Using the Brand Consistency KPI Dashboard
1️⃣ Define Clear KPIs
- Ensure that all KPIs align with your brand’s goals. Common Brand Consistency KPIs include:
- Brand Recognition Score
- Social Media Engagement Consistency
- Customer Satisfaction Rating
- Adherence to Brand Guidelines
- Logo & Color Scheme Compliance
2️⃣ Regularly Update Data
Update the Actual Numbers Input Sheet and Target Sheet each month to maintain accurate tracking.
3️⃣ Monitor Trends Over Time
Utilize the KPI Trend Sheet to identify long-term patterns and make strategic branding adjustments.
4️⃣ Use Conditional Formatting for Quick Insights
Leverage the built-in up/down arrows to quickly assess areas of improvement or concern.
5️⃣ Ensure Stakeholder Collaboration
- Share the dashboard with marketing teams, designers, and brand managers for aligned efforts.
- Common Challenges and How to Overcome Them
Conclusion
Click to Brand Consistency KPI
A Brand Consistency KPI Dashboard in Excel is a powerful tool for monitoring and improving branding efforts. With real-time tracking, trend analysis, and historical comparisons, businesses can ensure their branding remains aligned with customer expectations and market trends. Implementing this dashboard can help achieve a strong, recognizable, and trusted brand identity over time.
Frequently Asked Questions (FAQs)
What is a Brand Consistency KPI Dashboard?
A Brand Consistency KPI Dashboard is an Excel-based tool designed to track and analyze key metrics related to brand consistency, such as customer perception, adherence to brand guidelines, and social media engagement.
How does this dashboard help improve brand consistency?
By providing MTD and YTD trends, target vs. actual comparisons, and historical data, businesses can ensure their branding efforts remain consistent and aligned with their objectives.
Can I customize the KPIs in the dashboard?
Yes! You can modify existing KPIs, add new ones, and adjust formulas in the KPI Definition Sheet to suit your business needs.
How often should I update the data?
For best results, update the actual numbers, target numbers, and previous year data at the start of each month.
What industries can use this dashboard?
Any industry that relies on consistent branding can use this tool, including marketing agencies, retail brands, service providers, and e-commerce businesses.
Can I share this dashboard with my team?
Absolutely! The Excel file can be shared across departments, ensuring all stakeholders have access to real-time brand performance data.
Click to Brand Consistency KPI
Visit our YouTube channel to learn step-by-step video tutorials


