Managing a budget effectively is crucial for businesses of all sizes. A Budget Adherence KPI Dashboard in Excel helps monitor financial performance, compare actual spending with allocated budgets, and ensure cost efficiency. This article explores how to create and use a Budget Adherence KPI Dashboard in Excel with detailed explanations, advantages, best practices, and frequently asked questions.
Click to Budget Adherence KPI
What is a Budget Adherence KPI Dashboard?
A Budget Adherence KPI Dashboard is a visual representation of key financial performance indicators (KPIs) that track and analyze budget adherence. It allows businesses to monitor monthly and yearly financial trends, identify discrepancies, and take corrective actions.
Key Features of the Budget Adherence KPI Dashboard
This ready-to-use template consists of seven essential worksheets that ensure accurate budget tracking and financial analysis:
Home Sheet
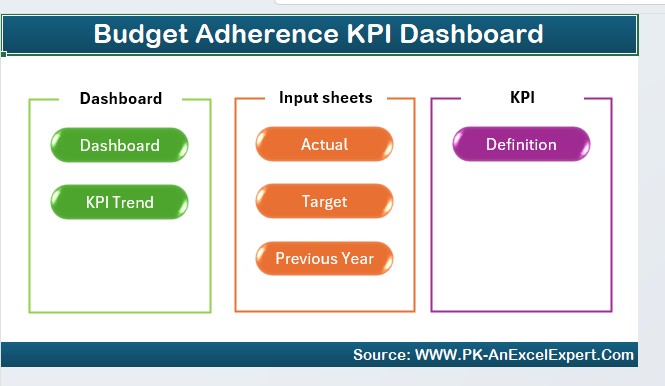
- Acts as the index sheet.
- Contains six navigation buttons for quick access to other sheets.
- Enhances user-friendliness and ease of use.
Dashboard Sheet Tab
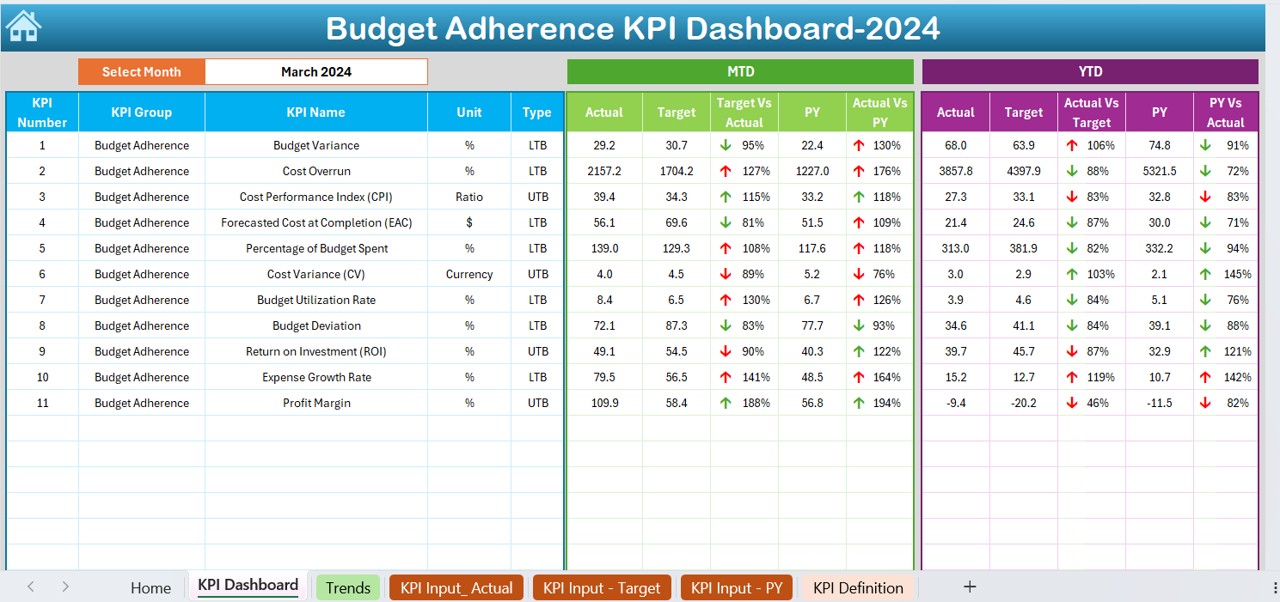
- The main reporting sheet displaying all KPI data.
- Users can select a month from the drop-down (D3).
Automatically updates:
- MTD (Month-to-Date) Actual, Target, and Previous Year data.
- YTD (Year-to-Date) Actual, Target, and Previous Year data.
- Conditional formatting with up/down arrows to indicate performance trends.
Click to Budget Adherence KPI
KPI Trend Sheet Tab
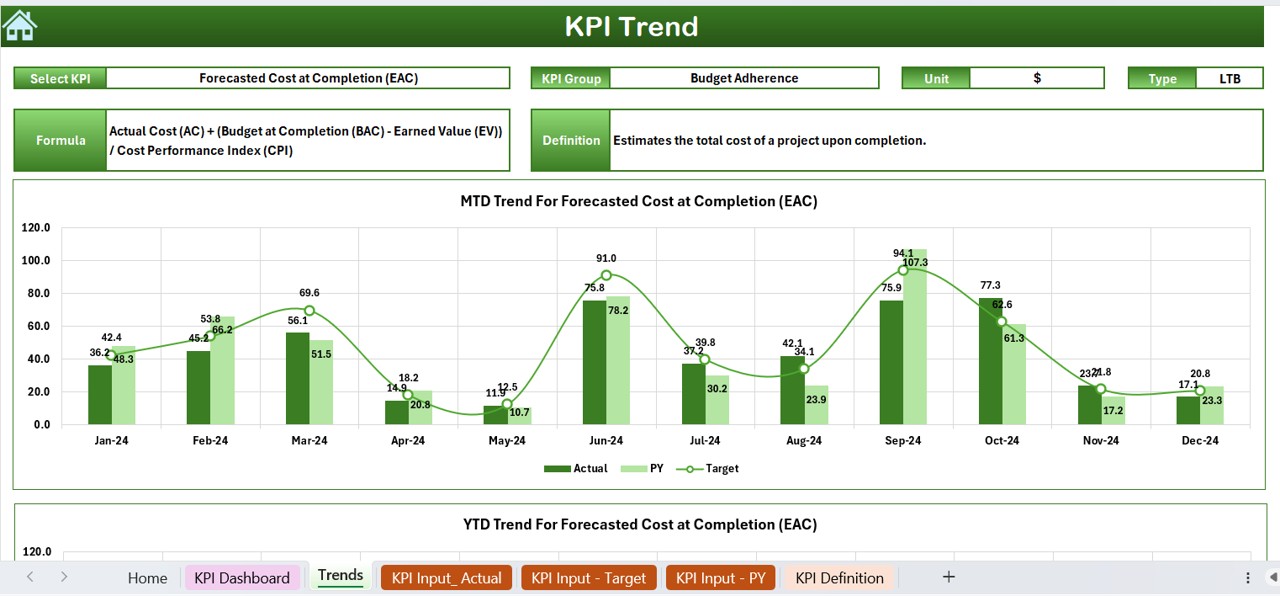
- Users can select a KPI from the drop-down (C3).
Displays:
- KPI Group, Unit, Type (Lower/Upper is better), Formula, and Definition.
- MTD & YTD trend charts for Actual, Target, and PY data.
Click to Budget Adherence KPI
Actual Numbers Input Sheet
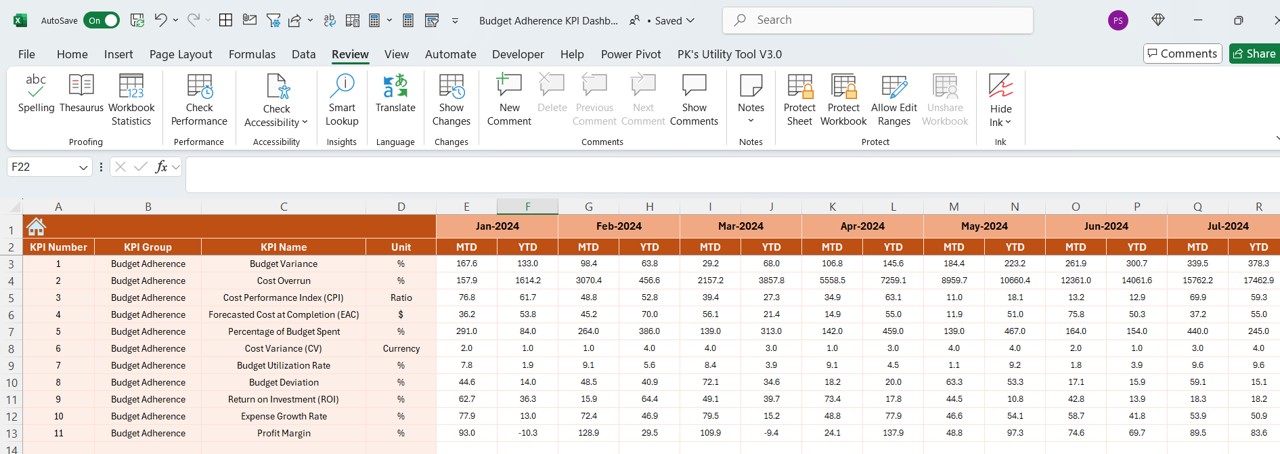
- Users enter actual values for MTD and YTD.
- Month selection available in E1 (updates all data dynamically).
Target Sheet Tab
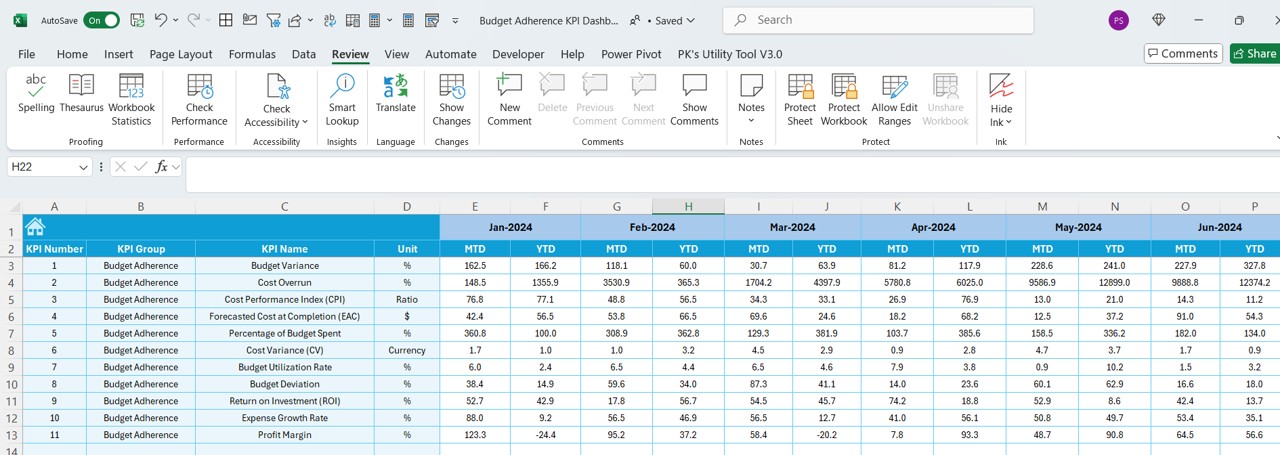
- Users input target values for each KPI.
- Supports both MTD and YTD targets.
Previous Year Number Sheet Tab
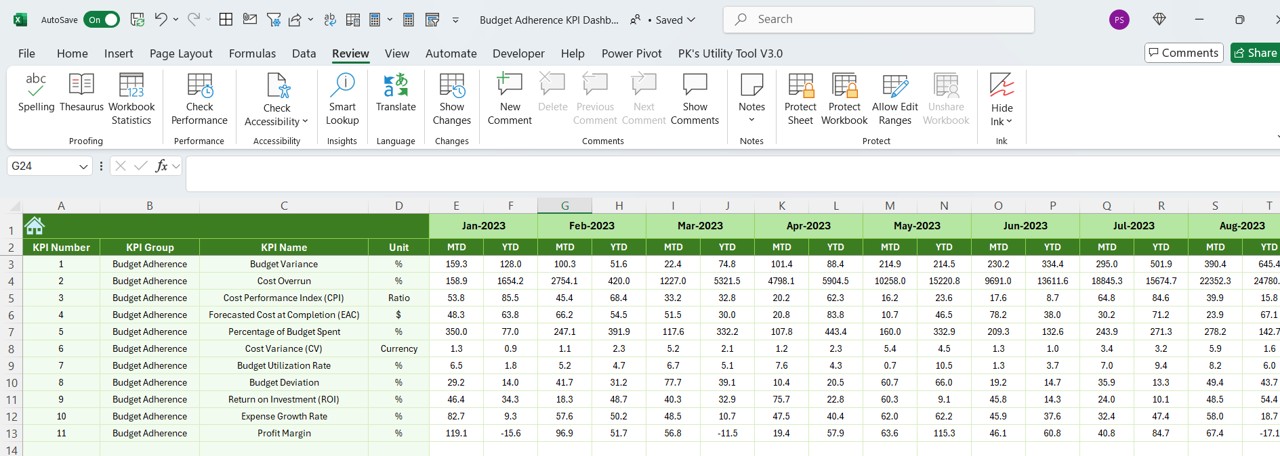
- Stores previous year’s KPI values.
- Essential for comparative analysis.
KPI Definition Sheet Tab
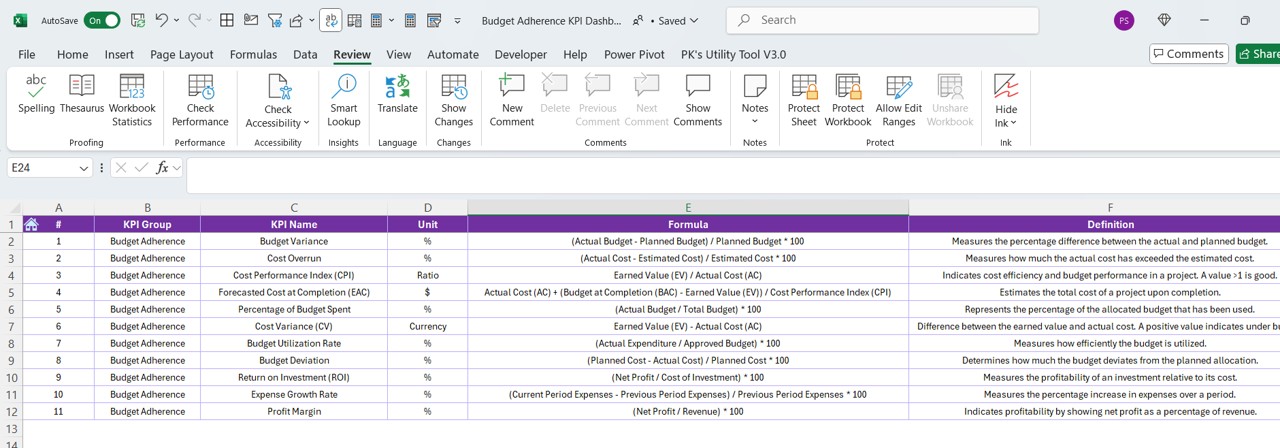
- Defines all KPIs with:
- KPI Name
- KPI Group
- Unit of Measure
- Formula
- KPI Definition
Advantages of Using a Budget Adherence KPI Dashboard
Click to Budget Adherence KPI
Improved Financial Control
- Monitors actual vs. budgeted expenses.
- Helps maintain cost discipline.
Data-Driven Decision Making
- Provides real-time budget tracking.
- Highlights over-spending areas.
Month-to-Month Analysis
- Enables trend analysis for MTD and YTD performance.
- Helps predict future financial trends.
Easy Customization
- Users can modify KPI definitions, targets, and formulas.
- Adaptable for different industries and financial structures.
Increased Accountability
- Ensures stakeholders are aware of financial performance.
- Encourages data-driven budgeting.
Best Practices for Using the Budget Adherence KPI Dashboard
Set Clear KPI Targets
Define realistic and achievable targets for MTD and YTD.
Regularly Update Data
Enter actual numbers at regular intervals to maintain accuracy.
Use Conditional Formatting
Utilize color codes and trend arrows to highlight performance deviations.
Review KPI Trends Monthly
Analyze the KPI Trend Sheet to make informed financial decisions.
Automate Data Inputs
Where possible, link data sources to auto-populate financial data.
Conclusion
A Budget Adherence KPI Dashboard in Excel is an essential tool for financial planning and analysis. By effectively tracking budget adherence KPIs, businesses can enhance financial control, identify discrepancies early, and make data-driven decisions. Whether you’re a small business owner, financial analyst, or corporate executive, this dashboard can simplify budget management and improve financial efficiency.
Click to Budget Adherence KPI
Frequently Asked Questions (FAQs)
What are Budget Adherence KPIs?
Budget Adherence KPIs measure how well actual financial performance aligns with planned budgets. Key indicators include budget variance, cost efficiency, and forecast accuracy.
How often should I update the Budget Adherence KPI Dashboard?
It is recommended to update the dashboard monthly to track trends and ensure accurate budget performance comparisons.
Can I customize the KPI Dashboard for my business needs?
Yes! The dashboard is fully customizable. You can add new KPIs, adjust formulas, and modify visualization elements.
What are the benefits of using conditional formatting in the dashboard?
Conditional formatting visually highlights key trends using color coding and arrows, making it easier to identify performance gaps at a glance.
How can I automate data entry in the Budget Adherence KPI Dashboard?
You can use Excel formulas, Power Query, or VBA scripts to pull data from external sources and automate the entry of actual and target values.
What industries can benefit from this Budget Adherence KPI Dashboard?
This dashboard is useful for all industries, including:
- Corporate finance
- Retail businesses
- Healthcare institutions
- Manufacturing firms
- Government agencies
What is the difference between MTD and YTD tracking in the dashboard?
- MTD (Month-to-Date): Measures performance for the current month.
- YTD (Year-to-Date): Measures cumulative performance from the beginning of the year.
Click to Budget Adherence KPI
Visit our YouTube channel to learn step-by-step video tutorials
View this post on Instagram