In today’s fast-paced business world, tracking performance is more important than ever. A Business Intelligence KPI Dashboard in Excel helps businesses monitor key performance indicators (KPIs) efficiently. It provides real-time insights, making it easier to analyze data, measure growth, and improve decision-making.
This guide will walk you through everything you need to know about the Business Intelligence KPI Dashboard in Excel—from its key features to its benefits, best practices, and frequently asked questions. Plus, we’ll introduce you to a ready-to-use Excel template that simplifies KPI tracking.
Click to Business Intelligence KPI
What is a Business Intelligence KPI Dashboard?
A Business Intelligence KPI Dashboard is an essential tool that consolidates critical metrics into one interactive and easy-to-read display. It enables businesses to track progress, compare targets with actual performance, and analyze trends. Instead of relying on multiple spreadsheets, this dashboard allows users to see everything in one place, helping them make data-driven decisions more efficiently.
With Excel, you don’t need advanced software like Power BI or Tableau. Instead, you can use built-in features to create a dynamic and powerful dashboard.
Key Features of the Business Intelligence KPI Dashboard
- This dashboard consists of seven worksheets, each designed for a specific purpose. Let’s go through them one by one:
Click to Business Intelligence KPI
Home Sheet
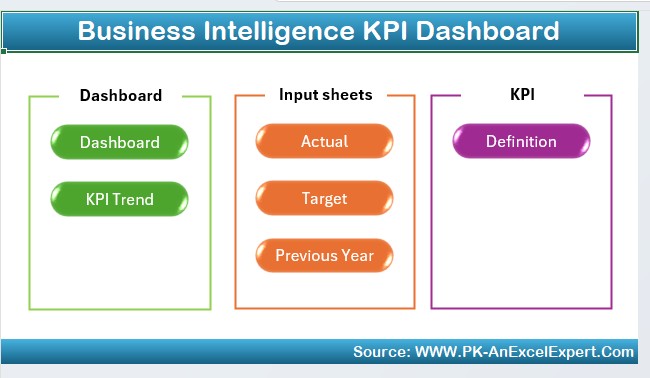
- This is the starting point of the dashboard.
- It includes six clickable buttons that take you to different sections instantly.
Dashboard Sheet (Main Dashboard)
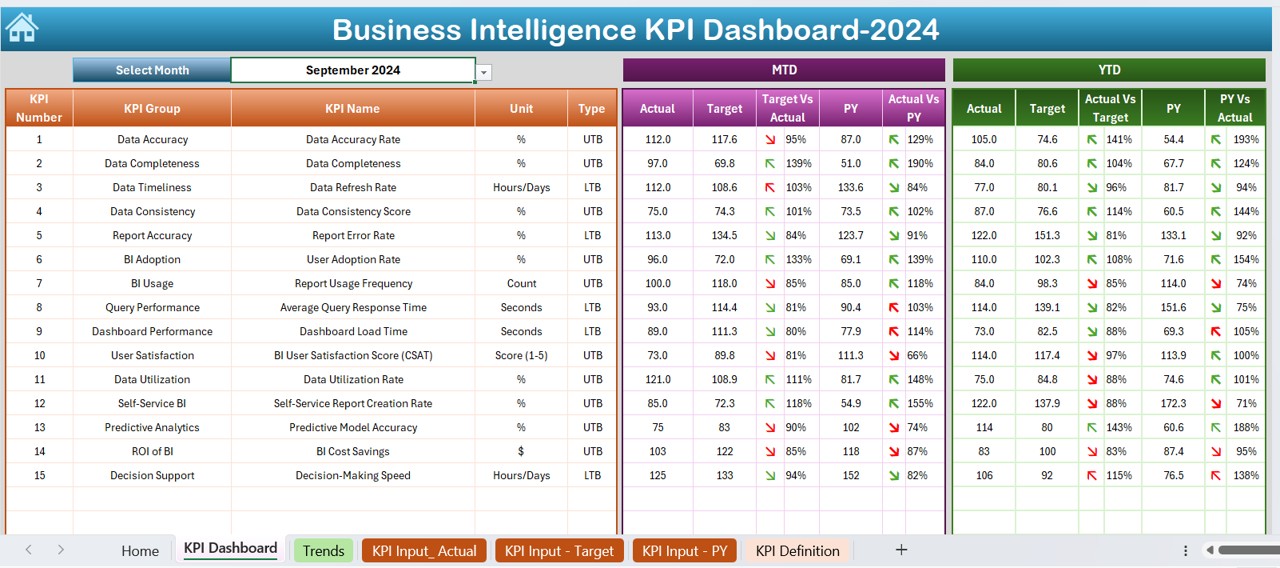
- The main section where all KPI metrics are displayed.
- Users can select a month using a drop-down menu (D3) to update all data accordingly.
- Displays MTD (Month-to-Date) and YTD (Year-to-Date) performance.
- Compares Actual vs. Target and Previous Year vs. Actual.
- Uses conditional formatting with up/down arrows to indicate whether performance is improving or declining.
KPI Trend Sheet
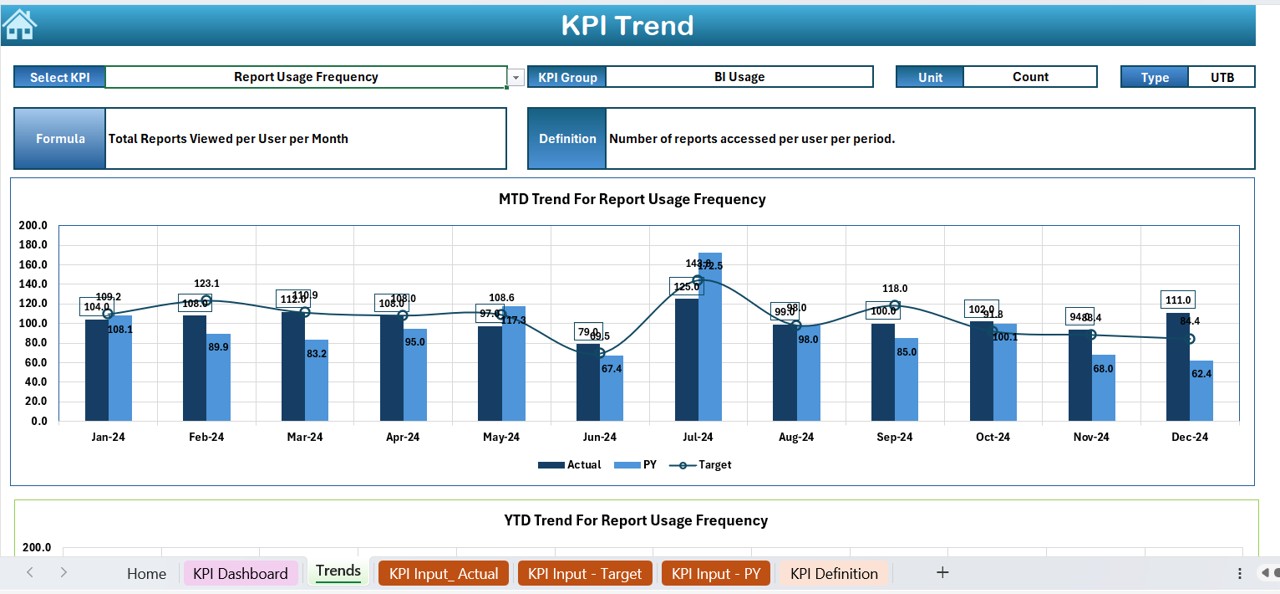
Users can select a KPI from the drop-down menu (C3) to view its trend over time.
Displays:
- KPI Group (e.g., Sales, Marketing, Finance, Operations)
- Unit of KPI (e.g., percentage, dollars, count)
- KPI Type (Lower is Better / Higher is Better)
- Formula used to calculate the KPI
- Definition of the KPI
- Provides trend charts for MTD and YTD values to visualize performance.
Click to Business Intelligence KPI
Actual Numbers Input Sheet
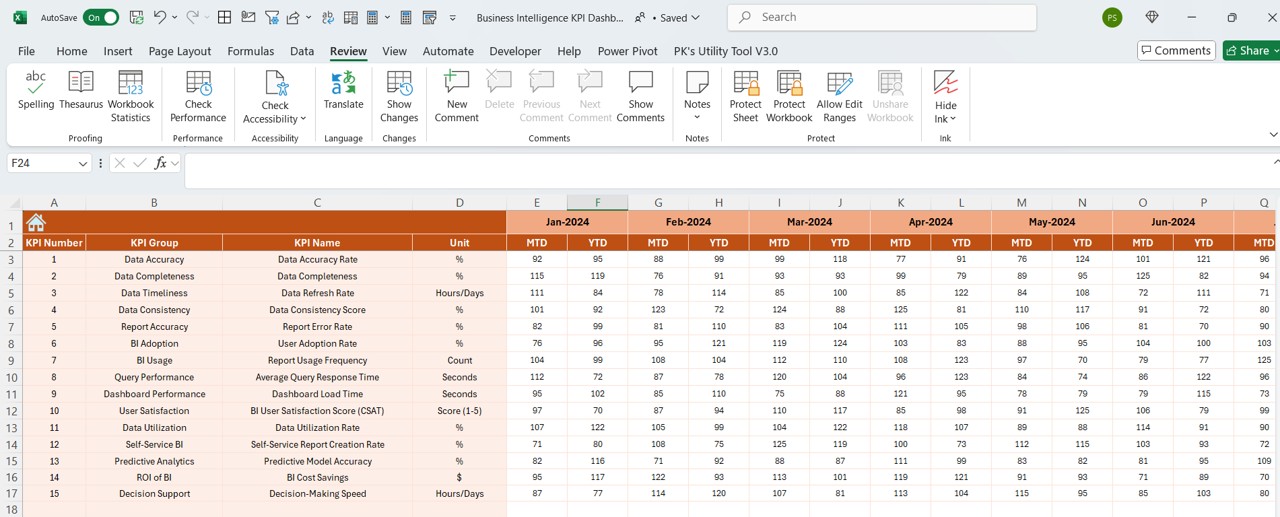
- This is where users input actual KPI numbers for each month.
- Enter YTD and MTD actual values in the corresponding fields.
- Select the reporting month using cell E1 to update data accordingly.
Target Sheet
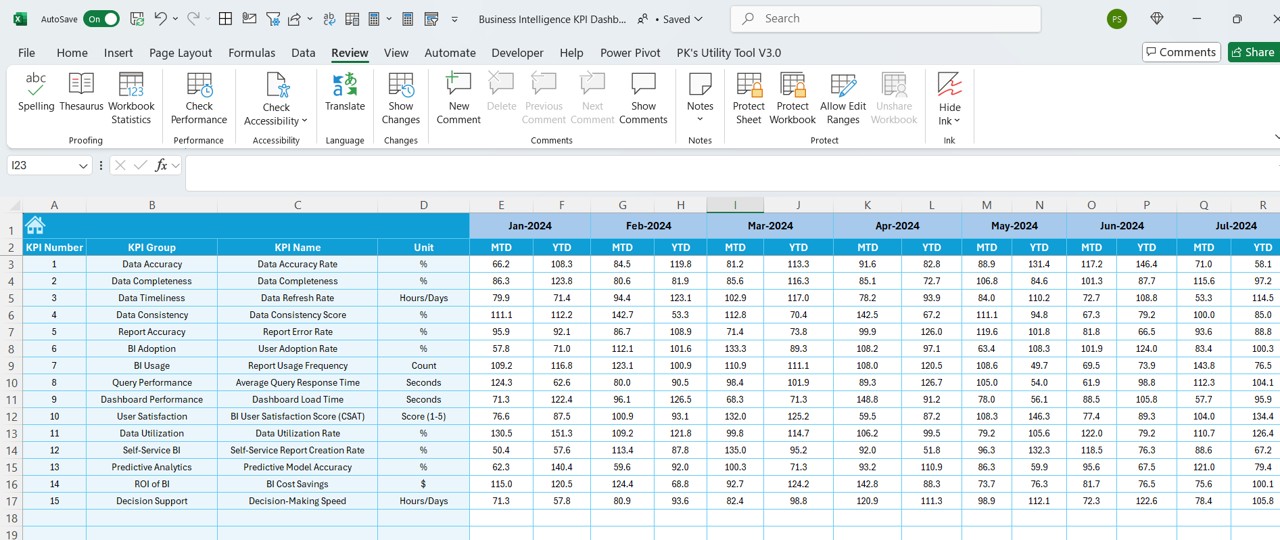
- Users enter target values for each KPI for both MTD and YTD.
- The dashboard then compares these targets with actual performance.
Previous Year Numbers Sheet
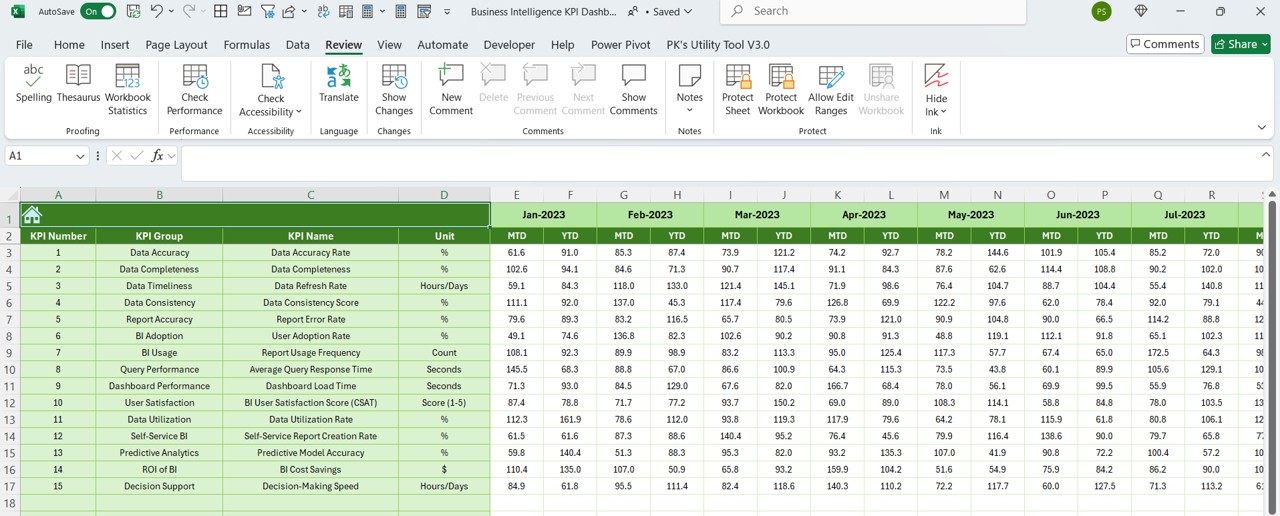
- Stores historical KPI values for comparison.
- Users input MTD and YTD numbers from the previous year to analyze progress.
KPI Definition Sheet
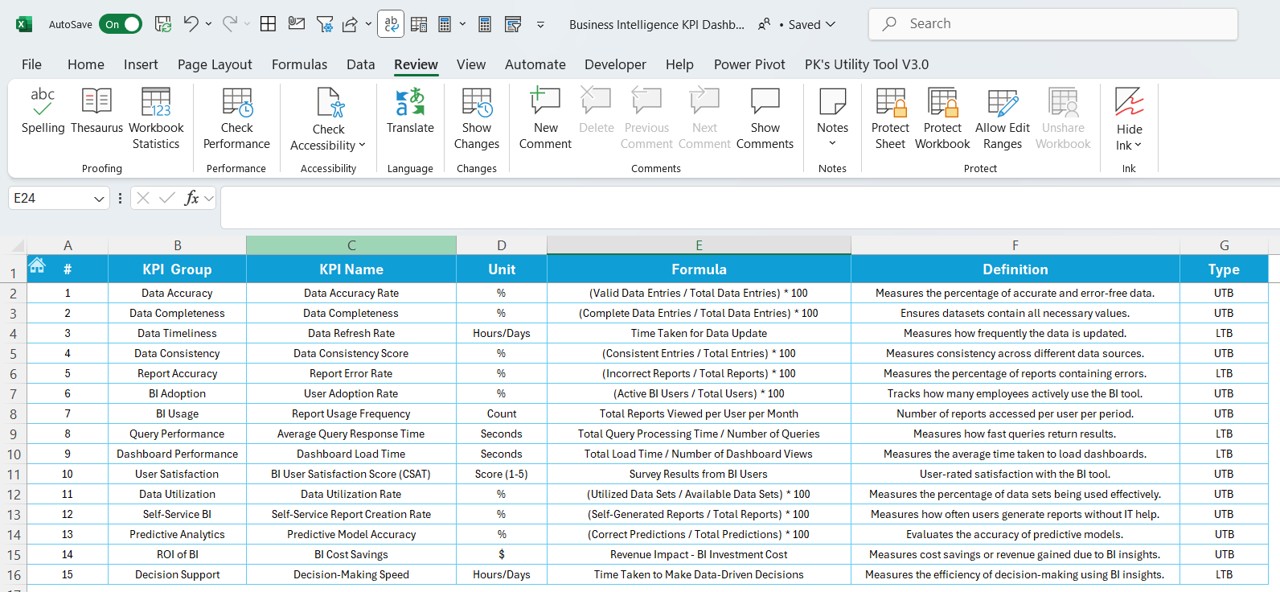
Maintains a clear record of all KPIs, including:
- KPI Name
- KPI Group
- Unit
- Formula
- Definition
Helps ensure consistency in KPI tracking across teams.
Why Use a Business Intelligence KPI Dashboard in Excel?
Click to Business Intelligence KPI
- User-Friendly and Accessible: No need for expensive software—Excel is widely used and easy to learn.
- Visual Representation of Data: Uses charts, conditional formatting, and interactive dropdowns for easy interpretation.
- Saves Time and Effort: Reduces the time spent on manual calculations and reporting.
- Tracks Performance in Real-Time: Allows businesses to monitor trends and compare performance against past data.
- Highly Customizable: Users can easily modify KPIs, add new data points, and change targets to fit business needs.
Best Practices for Using the Business Intelligence KPI Dashboard
- Set Clear and Relevant KPIs: Choose KPIs that align with your business goals and are measurable.
- Ensure Accurate Data Entry: Regularly update Actual, Target, and Previous Year values to maintain accuracy.
- Analyze Trends Frequently: Use the KPI Trend Sheet to identify patterns and adjust strategies accordingly.
- Use Conditional Formatting Wisely: Apply color-coded indicators and up/down arrows to highlight significant changes.
- Keep Historical Data Updated: Maintaining past records helps track improvements over time.
- Adapt the Dashboard to Your Needs: Modify layouts, add new KPIs, or update calculations to reflect business priorities.
Conclusion
A Business Intelligence KPI Dashboard in Excel is a powerful yet simple way to track your company’s performance. With features like MTD & YTD tracking, trend charts, and interactive inputs, this tool provides a holistic view of your business metrics.
With Excel, you get an affordable and customizable alternative to expensive business intelligence tools. By regularly updating your data and following best practices, you can optimize performance, make informed decisions, and achieve business success.
Frequently Asked Questions (FAQs)
What is a KPI Dashboard in Excel?
A KPI Dashboard in Excel is a tool that consolidates business metrics in one place, allowing users to track progress, analyze trends, and compare performance against targets.
Can I customize this KPI Dashboard?
Absolutely! You can modify KPI definitions, adjust formulas, and add visual elements to suit your business needs.
Who can benefit from this dashboard?
This dashboard is useful for small businesses, large enterprises, startups, and freelancers looking to track and analyze business performance.
Do I need advanced Excel skills to use this dashboard?
Not at all! Basic Excel skills are enough to navigate and update the dashboard effectively.
Can I use this in Google Sheets?
Yes, but some Excel-specific features (like conditional formatting and dropdowns) may not work exactly the same in Google Sheets. You may need to make minor adjustments.
Click to Business Intelligence KPI
Visit our YouTube channel to learn step-by-step video tutorials
View this post on Instagram