In today’s fast-moving customer service industry, tracking and improving performance is essential. One of the most critical key performance indicators (KPIs) for call centers is the Call Abandonment Rate. If this rate is high, it can negatively impact customer satisfaction and business performance. Therefore, it is crucial to monitor and reduce it effectively.
To help with this, we have created a Call Abandonment Rate KPI Dashboard in Excel. This ready-to-use template provides an easy and interactive way to track call abandonment KPIs. In this guide, we will walk you through its features, benefits, and best practices so you can make the most of it.
Click to Call Abandonment Rate KPI
What is Call Abandonment Rate?
The Call Abandonment Rate refers to the percentage of inbound calls that customers disconnect before they speak to an agent. It is calculated using the formula:
A high call abandonment rate usually means long wait times, poor customer service, or inadequate staffing. Therefore, reducing this rate should be a top priority for businesses.
Key Features of the Call Abandonment Rate KPI Dashboard
This Excel-based dashboard is designed to provide a comprehensive and structured view of the Call Abandonment Rate KPI along with other key metrics. It consists of seven worksheets, each serving a different purpose.
Home Sheet (Index Sheet)
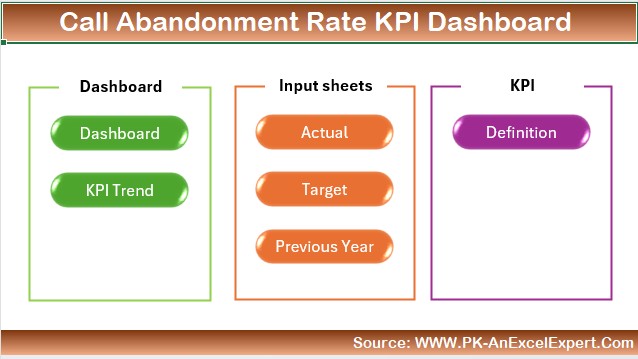
- This sheet serves as a navigation hub and includes six buttons for easy access to different sections.
- With just a click, users can jump to the relevant sheets and quickly find the information they need.
Click to Call Abandonment Rate KPI
Dashboard Sheet (Main Dashboard)
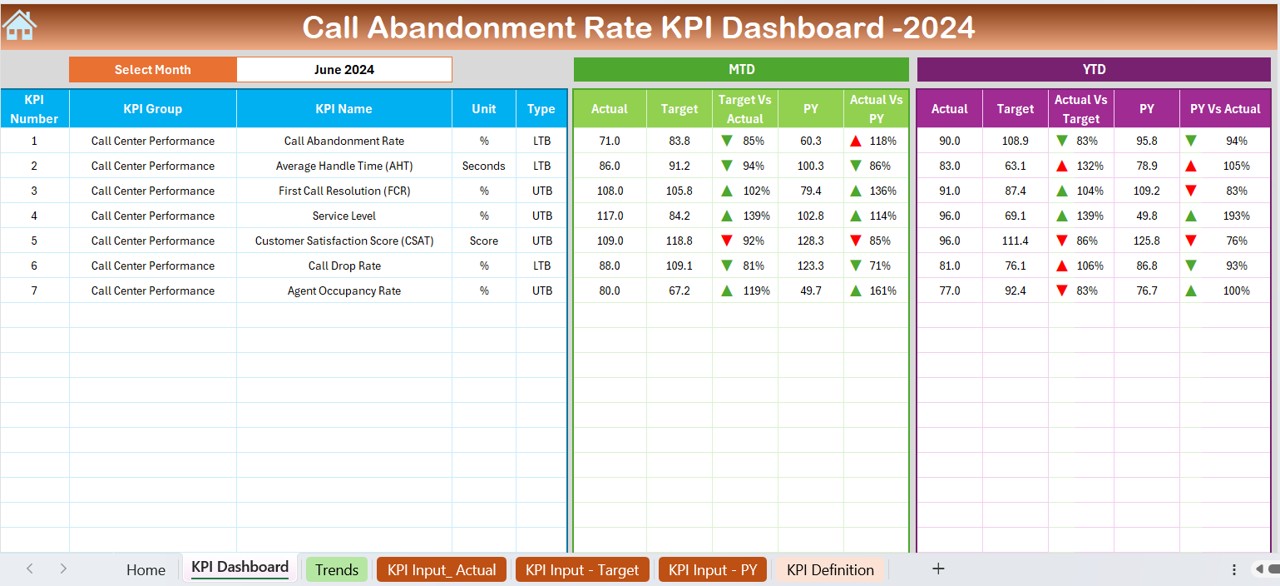
- This is the core section of the dashboard, displaying all important KPI information.
- A drop-down menu (D3) allows users to select a month and update all metrics in real time.
Key indicators include:
- MTD (Month-to-Date) and YTD (Year-to-Date) Actuals, Targets, and Previous Year Data.
- Conditional formatting with arrows to show if metrics are improving or declining.
- Comparison of Target vs. Actual and Previous Year vs. Actual.
KPI Trend Sheet
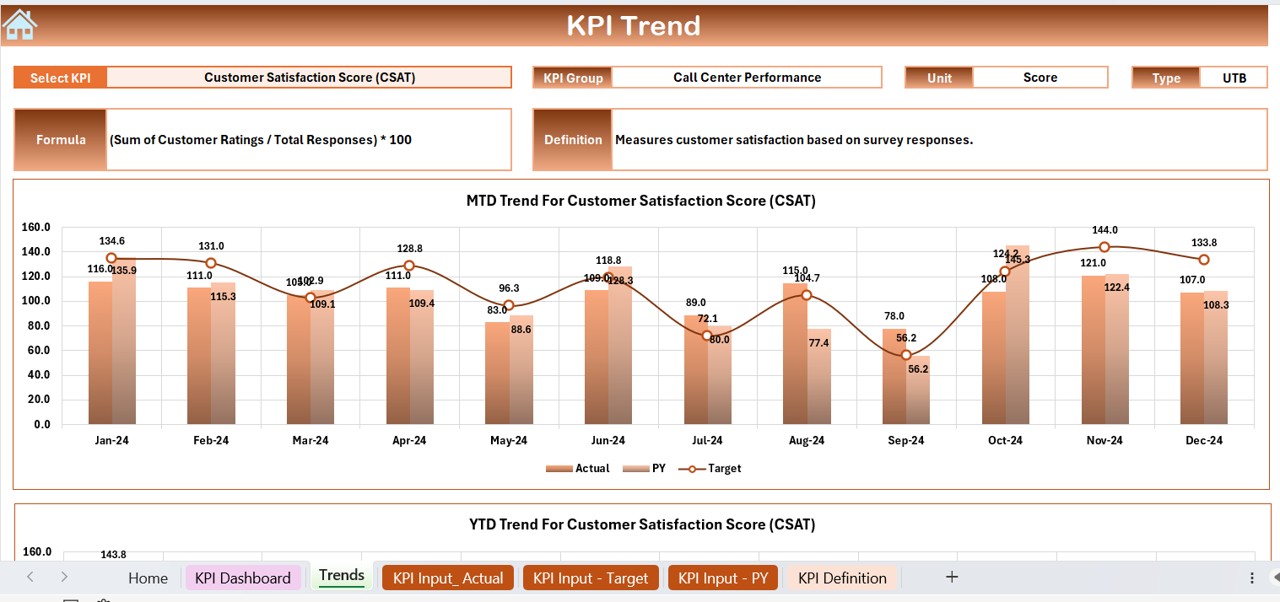
- Users can select a KPI from a drop-down menu in C3.
- Displays KPI Group, Unit, Type (Lower/Upper is Better), Formula, and Definition.
- Includes trend charts showing MTD and YTD performance.
Actual Numbers Input Sheet
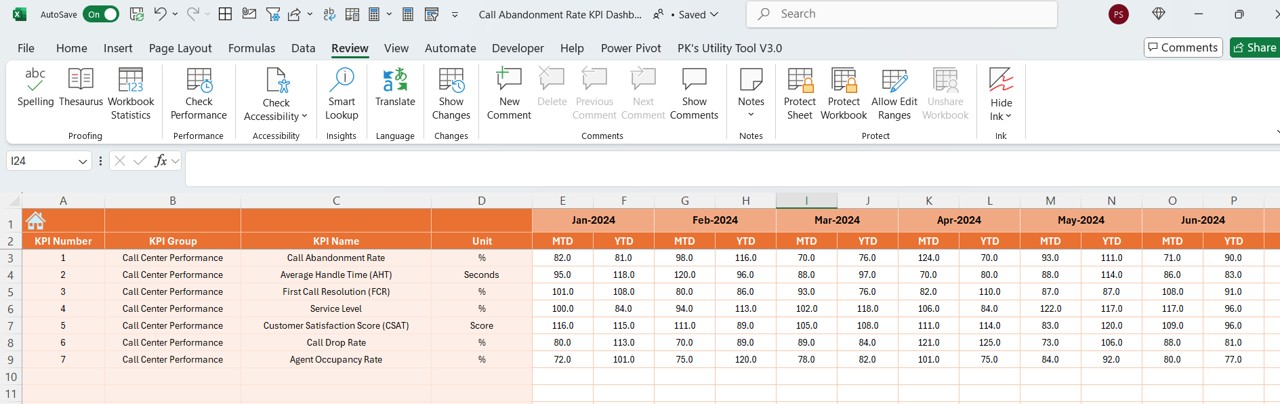
- This is where users input actual performance numbers for both YTD and MTD.
- Users can change the month using E1 (by entering the first month of the year).
Target Sheet
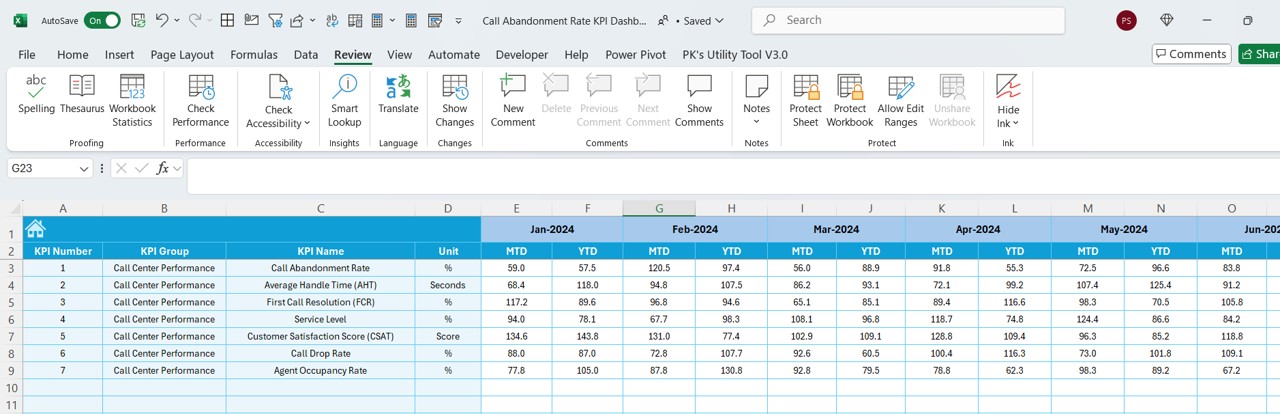
- This sheet allows users to set monthly targets for MTD and YTD metrics.
Previous Year Data Sheet
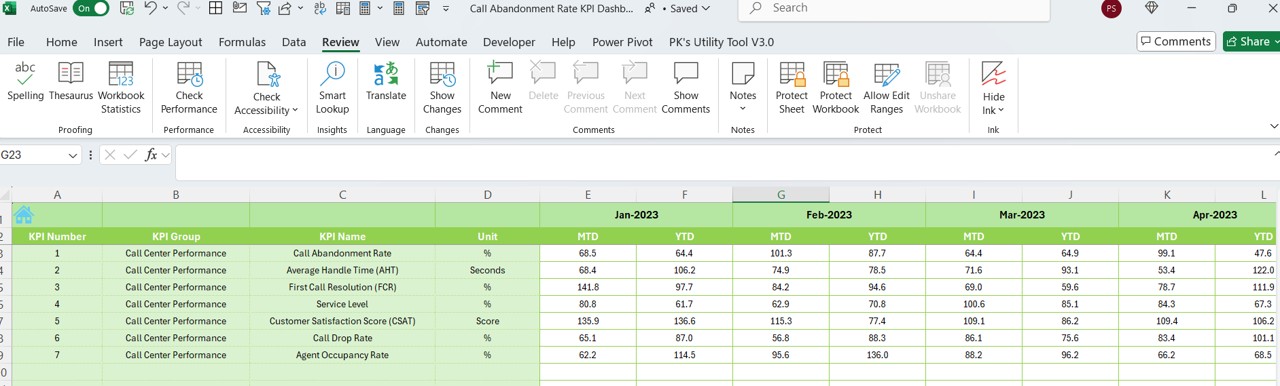
- Users can store previous year’s performance numbers.
- This enables comparison and trend analysis.
KPI Definition Sheet
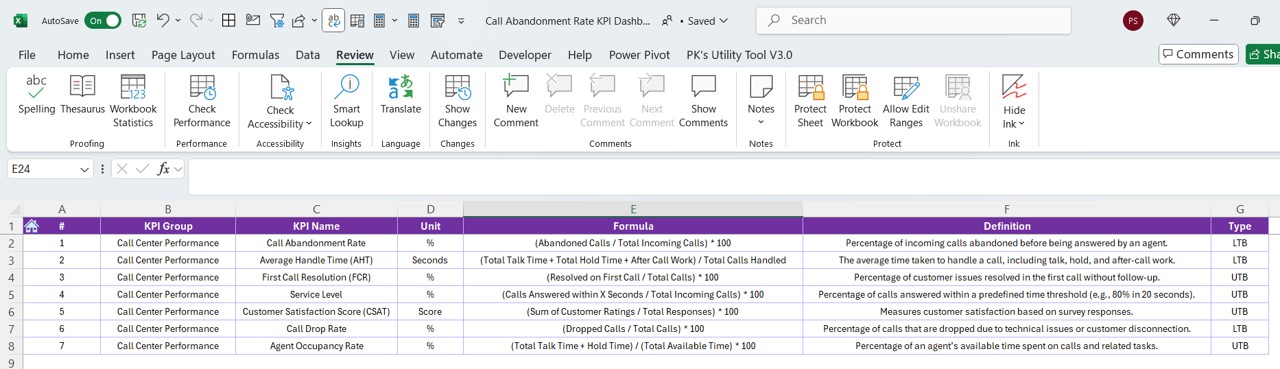
Users enter detailed KPI information, including:
- KPI Name
- KPI Group
- Unit of Measurement
- Formula
- Definition
This ensures clarity and standardization across the entire dashboard.
Advantages of Using the Call Abandonment Rate KPI Dashboard
- Real-Time Tracking: Instantly track call abandonment trends and make data-driven decisions.
- Improved Decision-Making: Helps managers identify weak areas and optimize resources efficiently.
- Fully Customizable: The dashboard is flexible and can be modified based on specific business needs.
- Automated Data Visualization: Graphs, conditional formatting, and real-time updates provide instant insights.
- Optimized Workforce Planning: Helps businesses allocate staff better, reducing customer frustration.
Best Practices for Using the Call Abandonment Rate KPI Dashboard
- Set Realistic Targets: Use past data and industry benchmarks to set achievable goals.
- Keep Data Updated: Regularly update actual numbers, targets, and previous year’s data to maintain accuracy.
- Analyze Trends: Use the KPI Trend Sheet to identify patterns and take proactive measures.
- Improve Customer Service: Implement solutions such as better queue management, increased staffing, and optimized IVR systems.
- Leverage Conditional Formatting: Use color-coded indicators to quickly visualize performance trends and issues.
Conclusion
The Call Abandonment Rate KPI Dashboard in Excel is an essential tool for call center managers and customer service teams. With real-time tracking, trend analysis, and automated data visualization, it helps businesses optimize their performance and improve customer satisfaction.
Frequently Asked Questions (FAQs)
Why is the Call Abandonment Rate important?
A high Call Abandonment Rate means that customers are not getting the help they need. This can harm customer experience and retention. Keeping it low ensures better service and higher satisfaction.
How can I reduce the Call Abandonment Rate?
- To lower the abandonment rate, try:
- Increasing the number of available agents
- Reducing wait times
- Improving IVR navigation
- Offering a call-back option
Can I customize this Excel dashboard for my business?
- Absolutely! The template is fully customizable, allowing you to add more KPIs, adjust formulas, and modify visual elements as needed.
What is a good benchmark for Call Abandonment Rate?
- It varies by industry, but generally:
- Less than 5% is excellent
- 5% – 10% is acceptable
- Above 10% indicates room for improvement
How frequently should I update the dashboard?
For best results, update the dashboard weekly or monthly, depending on your business needs.
Click to Call Abandonment Rate KPI
Visit our YouTube channel to learn step-by-step video tutorials
View this post on Instagram