Home>Blogs>Charts and Visualization>Candle info-graphics chart in Excel>Candle Infographics Chart in Excel
Candle Infographics Chart in Excel
26
Dec 2023
0Comments Off on Candle Infographics Chart in Excel
PK
Meet PK, the founder of PK-AnExcelExpert.com! With over 15 years of experience in Data Visualization, Excel Automation, and dashboard creation. PK is a Microsoft Certified Professional who has a passion for all things in Excel. PK loves to explore new and innovative ways to use Excel and is always eager to share his knowledge with others. With an eye for detail and a commitment to excellence, PK has become a go-to expert in the world of Excel. Whether you're looking to create stunning visualizations or streamline your workflow with automation, PK has the skills and expertise to help you succeed. Join the many satisfied clients who have benefited from PK's services and see how he can take your Excel skills to the next level!
https://www.pk-anexcelexpert.com
Related Articles
Portfolio Performance KPI Dashboard in Excel
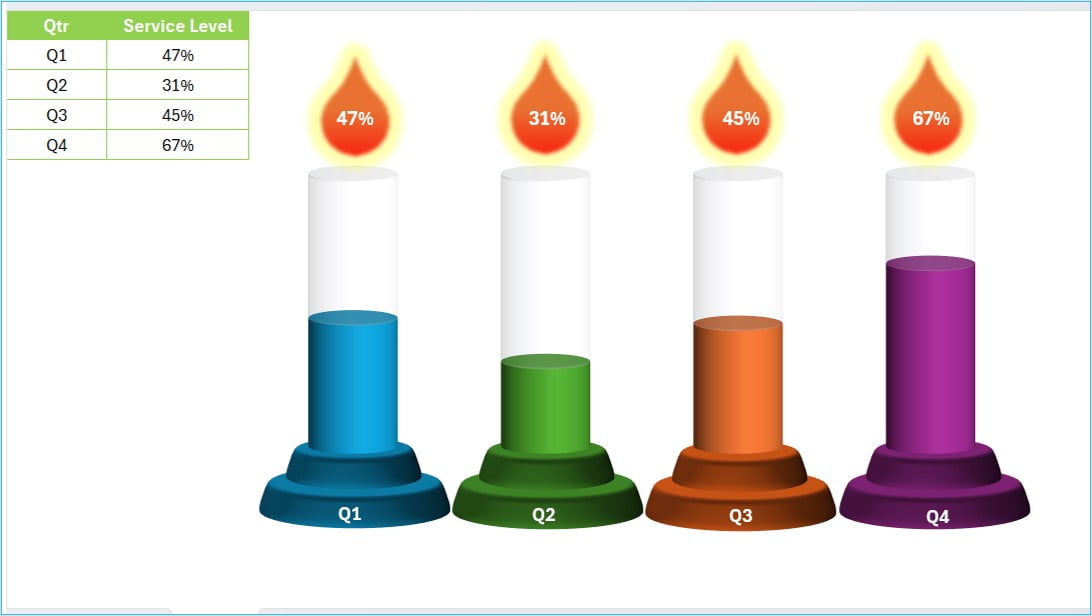
In the world of investing, keeping track of your portfolio’s performance is crucial. Whether you're an individual investor or managing
Mastering VStack and HStack Functions in Excel
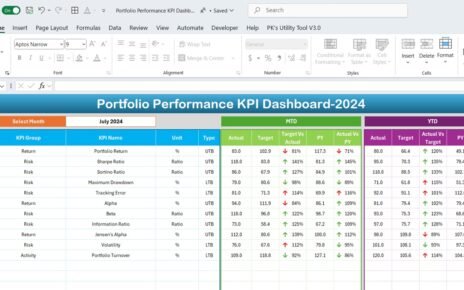
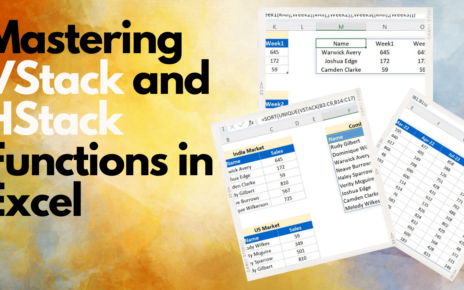
Microsoft Excel has always been an indispensable tool for data manipulation and analysis. You can combine the data with the
Aviation Operations KPI Dashboard in Excel
Aviation operations involve the seamless coordination of many variables to ensure safe, efficient, and timely travel. From flight schedules to