
As climate change continues to dominate global conversations, businesses are increasingly adopting strategies to reduce their carbon footprint. One effective way of tracking and improving these efforts is by using a Carbon Footprint KPI Dashboard. In this article, we’ll explore how to set up an efficient Carbon Footprint KPI Dashboard in Excel, which allows organizations to monitor their environmental impact, set sustainability goals, and track progress toward carbon reduction targets.
This ready-to-use Excel template is designed to help businesses understand their carbon emissions, compare them against targets, and analyze performance over time. With a clear structure and intuitive design, this dashboard enables easy data entry, updates, and insightful reporting.
Let’s dive into the features and benefits of using a Carbon Footprint KPI Dashboard and explore how it can transform the way your business tracks and manages its environmental impact.
Table of Contents
ToggleKey Features of the Carbon Footprint KPI Dashboard
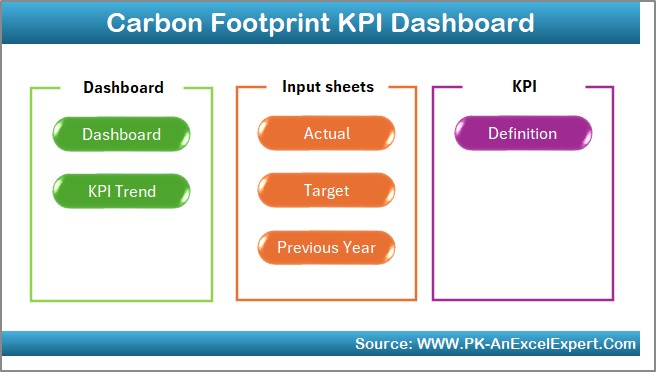
The Carbon Footprint KPI Dashboard in Excel includes seven essential worksheets that help manage and visualize your carbon emissions data. Below is a breakdown of each worksheet and its functionalities:
1. Home Sheet Tab
This tab serves as the central hub of the dashboard, offering easy navigation to all other worksheets. It simplifies jumping between different sections of the dashboard, ensuring users can quickly access the necessary data.
Click to buy Carbon Footprint KPI Dashboard in Excel
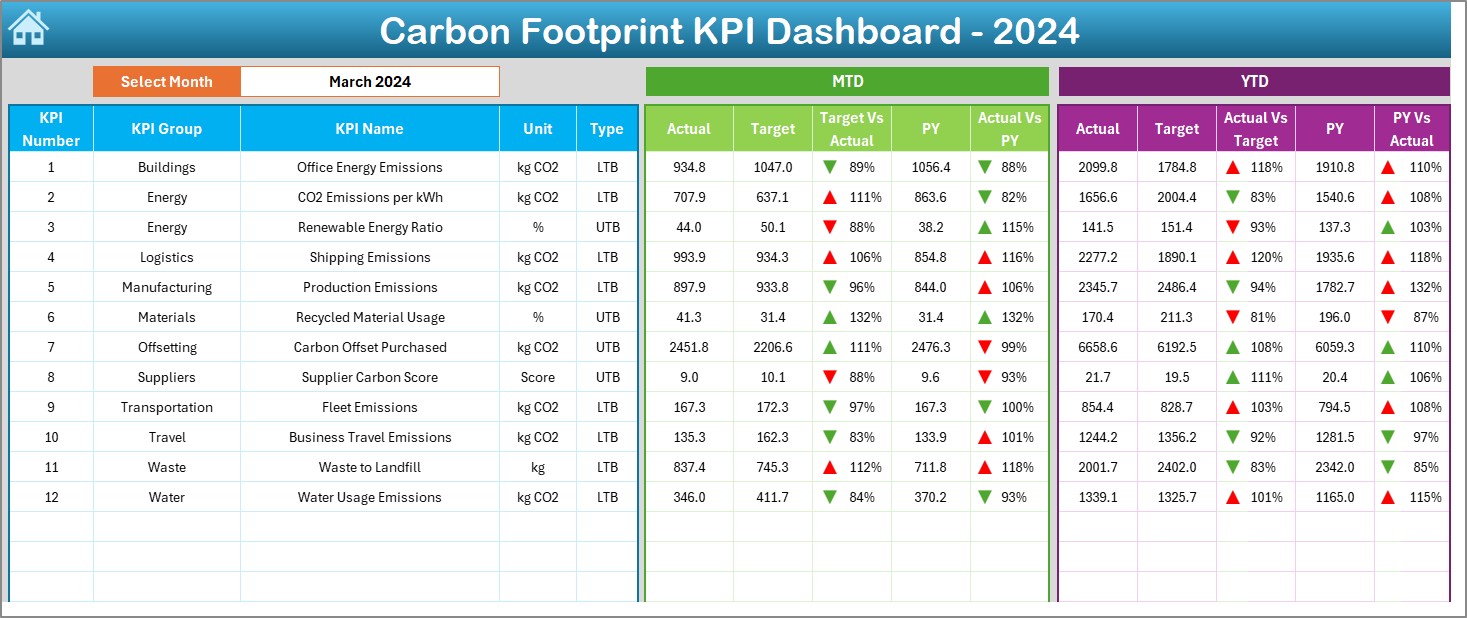
2. Dashboard Sheet Tab
The Dashboard Sheet is the heart of the Carbon Footprint KPI Dashboard. Here, you can see:
-
MTD (Month-to-Date) and YTD (Year-to-Date) data for various carbon footprint KPIs.
-
Target vs. Actual and Previous Year vs. Actual comparisons using conditional formatting (up/down arrows) to quickly visualize performance.
-
A dropdown menu in Range D3 allows users to select the month, and the dashboard will automatically update with the relevant data.
Click to buy Carbon Footprint KPI Dashboard in Excel
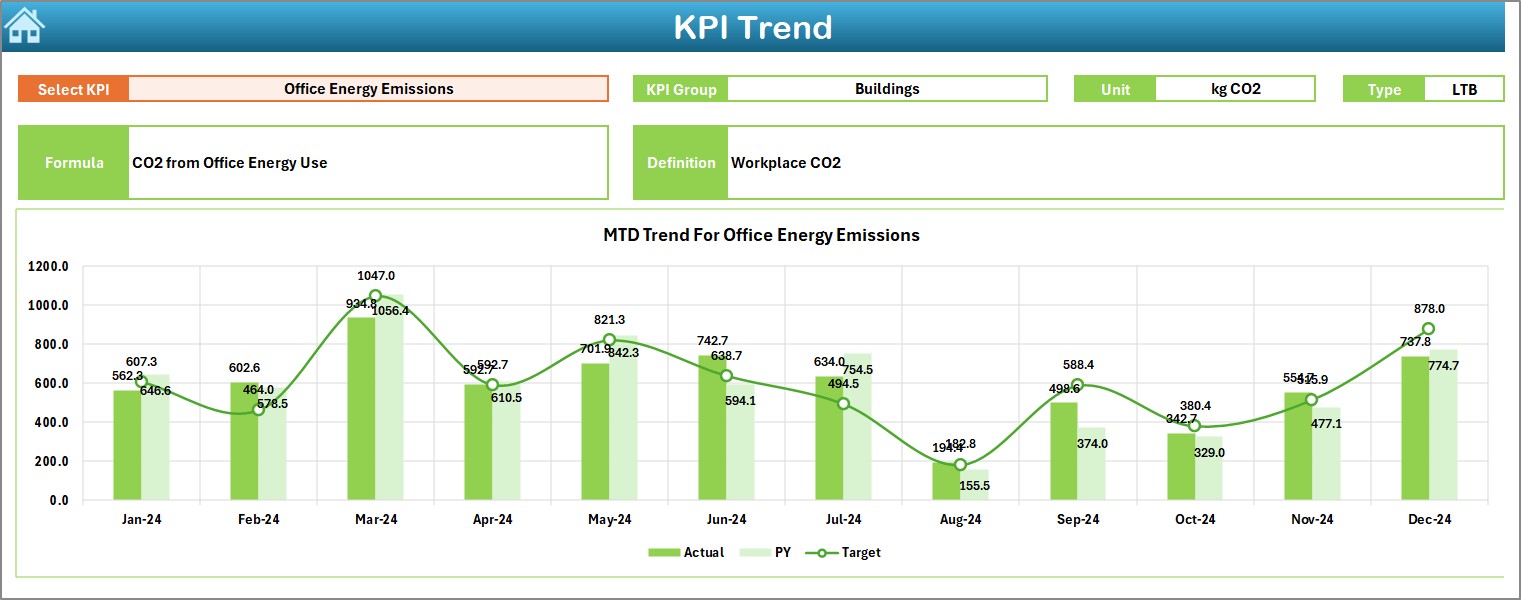
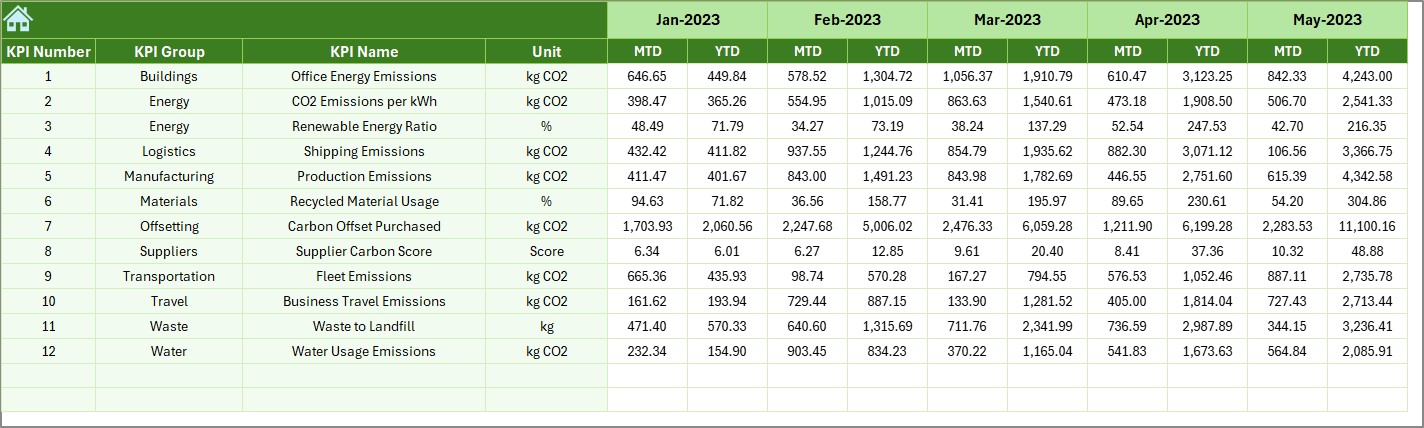
3. KPI Trend Sheet Tab
This tab tracks the trend of different KPIs over time. Key features include:
-
KPI Group: Categorizes each KPI for easy understanding.
-
Unit of Measurement: Displays the unit used for the KPI (e.g., kilograms of CO2).
-
KPI Type: Indicates whether the KPI is “Lower the Better” (LTB) or “Upper the Better” (UTB).
-
Formula and Definition: Provides the formula for each KPI and its definition to ensure clarity.
Click to buy Carbon Footprint KPI Dashboard in Excel
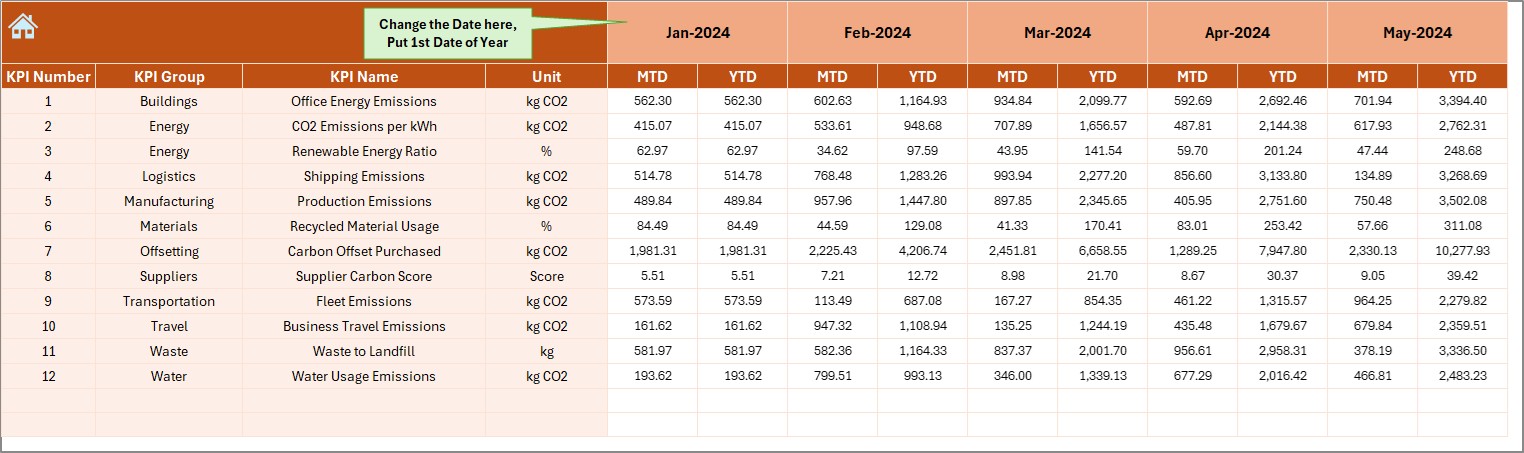
4. Actual Number Sheet Tab
In this sheet, you enter the actual carbon footprint values for each month and for YTD (Year-to-Date). Simply input the first month of the year in Range E1, and the dashboard will automatically adjust accordingly.
5. Target Sheet Tab
Here, you can input the target values for each KPI on both MTD and YTD bases. This allows you to track your progress and compare the actual numbers against the planned targets.

6. Previous Year Numbers Sheet Tab
In this tab, you enter the previous year’s carbon footprint data. This is useful for making year-over-year comparisons to assess whether your carbon footprint is improving or worsening over time.
Click to buy Carbon Footprint KPI Dashboard in Excel
7. KPI Definition Sheet Tab
This sheet serves as a reference for all the KPIs in the dashboard. You can input:
-
KPI Name
-
KPI Group
-
Unit of Measurement
-
Formula
-
KPI Definition
Advantages of Using the Carbon Footprint KPI Dashboard
The Carbon Footprint KPI Dashboard offers several key advantages for businesses committed to reducing their environmental impact. Let’s explore these benefits in detail:
- Real-Time Performance Monitoring: By tracking key performance indicators (KPIs) in real time, businesses can gain immediate insights into their environmental impact. The dashboard allows for monthly updates and quick comparisons, ensuring that sustainability efforts stay on track.
- Data-Driven Decision Making: The dashboard empowers organizations to make informed decisions based on actual performance data. This helps prioritize areas where carbon emissions need to be reduced, ensuring that resources are allocated efficiently.
- Clear and Accessible Visualization: The use of conditional formatting (such as up/down arrows) and easy-to-read charts allows business leaders to quickly assess performance without needing to dive deep into raw data.
- Goal Setting and Tracking: With the ability to set target values for each KPI, businesses can easily compare actual performance against target goals. This makes it easier to track progress toward sustainability goals and identify areas for improvement.
- Customizable to Fit Specific Needs; The template is highly customizable, meaning that businesses can tailor the dashboard to reflect their specific carbon footprint metrics, including energy usage, waste generation, and transportation emissions, among others.
Opportunities for Improvement in the Carbon Footprint KPI Dashboard
Click to buy Carbon Footprint KPI Dashboard in Excel
Although the Carbon Footprint KPI Dashboard in Excel is a powerful tool, there are several ways to enhance its functionality and usability:
- Integrating Automation: One of the key opportunities for improvement is automating the data entry process. By linking the dashboard to external data sources (such as energy usage reports or transport logs), businesses can reduce manual entry and update the dashboard in real time.
- Advanced Data Analysis with Power BI: Consider integrating the Carbon Footprint KPI Dashboard with Power BI to enhance data visualization capabilities. Power BI’s interactive charts and advanced analysis tools could provide deeper insights into trends and performance over time.
- Adding Predictive Analytics: Businesses can also consider incorporating predictive analytics to forecast future carbon footprints based on current trends. This would allow organizations to proactively adjust their operations to meet future sustainability goals.
- Mobile Optimization: To increase accessibility, consider optimizing the dashboard for mobile use. This would allow managers and stakeholders to access the dashboard on the go and monitor their carbon footprint from anywhere.
- Adding More KPIs: While the dashboard tracks a range of carbon footprint indicators, adding additional KPIs that focus on specific environmental metrics, such as water usage or supply chain emissions, could further enhance its utility.
Best Practices for Using the Carbon Footprint KPI Dashboard
Click to buy Carbon Footprint KPI Dashboard in Excel
To get the most out of your Carbon Footprint KPI Dashboard, here are some best practices to follow:
- Regular Updates and Consistent Data Entry: Ensure that data is entered regularly to keep the dashboard up to date. This includes inputting both actual values and targets at the start of each period.
- Review and Adjust KPIs Periodically; Over time, your business’s carbon footprint targets may evolve. Be sure to review and adjust the KPIs in the dashboard periodically to reflect any changes in your sustainability strategy or operational goals.
- Set Achievable and Realistic Targets: While it’s important to set ambitious sustainability goals, ensure they are also achievable. Unrealistic targets can lead to frustration and demotivation, while achievable targets can drive continuous improvement.
- Focus on Actionable KPIs: Keep the dashboard focused on the most impactful KPIs. By concentrating on the key metrics that have the greatest effect on your overall carbon footprint, you’ll be able to implement more effective strategies.
- Encourage Collaboration and Accountability: Share the dashboard with relevant stakeholders across departments. Encourage collaboration and assign accountability to ensure everyone is working together toward reducing the organization’s carbon footprint.
Frequently Asked Questions (FAQs)
1. What is a Carbon Footprint KPI Dashboard?
A Carbon Footprint KPI Dashboard is a tool used to track and monitor key performance indicators related to carbon emissions. It helps businesses assess their environmental impact, set sustainability goals, and measure progress over time.
2. How do I use the Carbon Footprint KPI Dashboard?
Simply input your actual carbon emissions data and target values into the corresponding worksheets. The dashboard will automatically calculate and display the relevant metrics, such as MTD, YTD, and Target vs. Actual.
3. Can I customize the KPIs in the dashboard?
Yes, the Carbon Footprint KPI Dashboard is fully customizable. You can adjust the KPIs, definitions, and formulas to suit your organization’s specific sustainability goals.
4. How often should I update the Carbon Footprint KPI Dashboard?
It is recommended to update the dashboard at least once a month to ensure that it reflects the most accurate and up-to-date information. This allows for timely decision-making and effective tracking of your sustainability efforts.
5. Can I integrate the Carbon Footprint KPI Dashboard with other tools?
Yes, you can integrate the dashboard with other tools such as Power BI for advanced data visualization or automation tools to pull in data from external sources. This can help streamline data entry and improve the accuracy of your tracking.
Conclusion
Click to buy Carbon Footprint KPI Dashboard in Excel
The Carbon Footprint KPI Dashboard in Excel is an essential tool for businesses committed to sustainability and reducing their environmental impact. By providing a clear and structured way to track carbon emissions and compare them to targets, this dashboard helps organizations make data-driven decisions and continuously improve their environmental performance.
Visit our YouTube channel to learn step-by-step video tutorials
Watch the step-by-step video Demo:


