In today’s fast-paced logistics world, ensuring the safety and security of cargo during transportation has become more important than ever. A single lapse can lead to massive financial losses, damaged reputation, and even legal consequences. But how do you measure and manage security effectively? That’s where a Cargo Security KPI Dashboard in Excel comes in handy.
This powerful and ready-to-use dashboard template helps security managers, logistics coordinators, and operations teams to track and improve their cargo security performance using real-time, data-driven insights.
Let’s dive deep into everything you need to know about creating, using, and benefiting from a Cargo Security KPI Dashboard in Excel.
Click to Cargo Security KPI
What is a Cargo Security KPI Dashboard?
A Cargo Security KPI Dashboard is an Excel-based visual tool that allows you to monitor key performance indicators (KPIs) related to cargo safety and security. These KPIs track incidents, preventions, compliance, losses, and other vital security metrics.
By using such a dashboard, you get a clear picture of how well your cargo is protected during transit, storage, and handling.
Why Do You Need a Cargo Security KPI Dashboard?
If you are managing any part of the supply chain, you already know how vital cargo security is. This dashboard provides a central place to:
- Monitor monthly and yearly cargo security data
- Track progress against security targets
- Identify areas that need improvement
- Make data-backed decisions quickly
- Communicate clearly with your team and stakeholders
Click to Cargo Security KPI
Worksheets Included in the Dashboard Template
We have built this dashboard with user-friendly navigation and fully automated calculations. The Excel file includes seven powerful worksheets:
Home Sheet
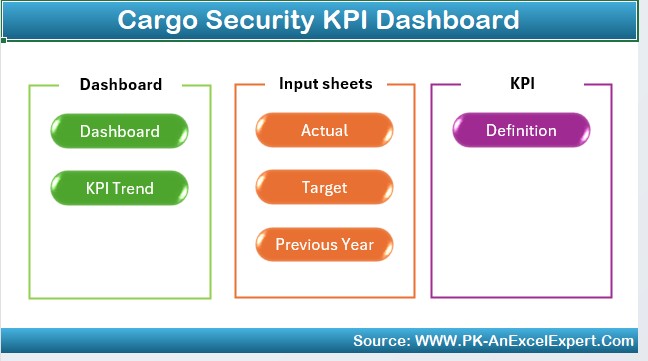
This is your main navigation panel. It includes clickable buttons to instantly jump to any of the following sheets. Think of it as the dashboard’s control center.
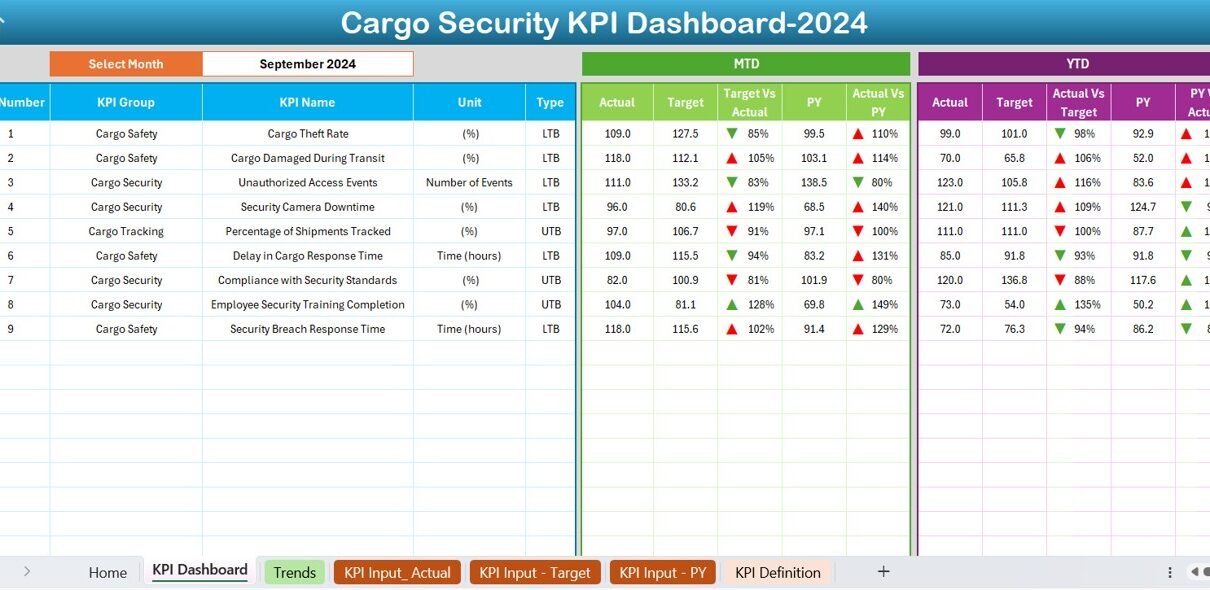
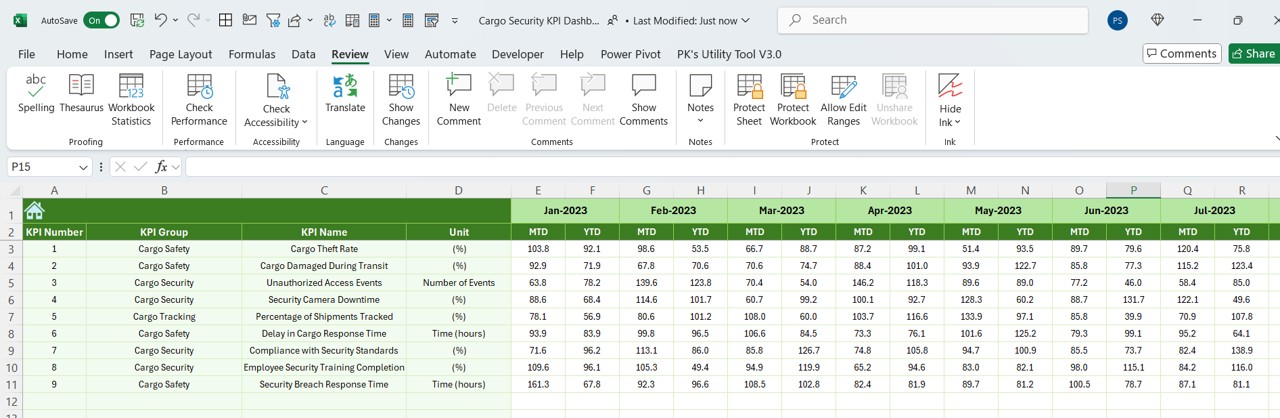
Dashboard Sheet Tab
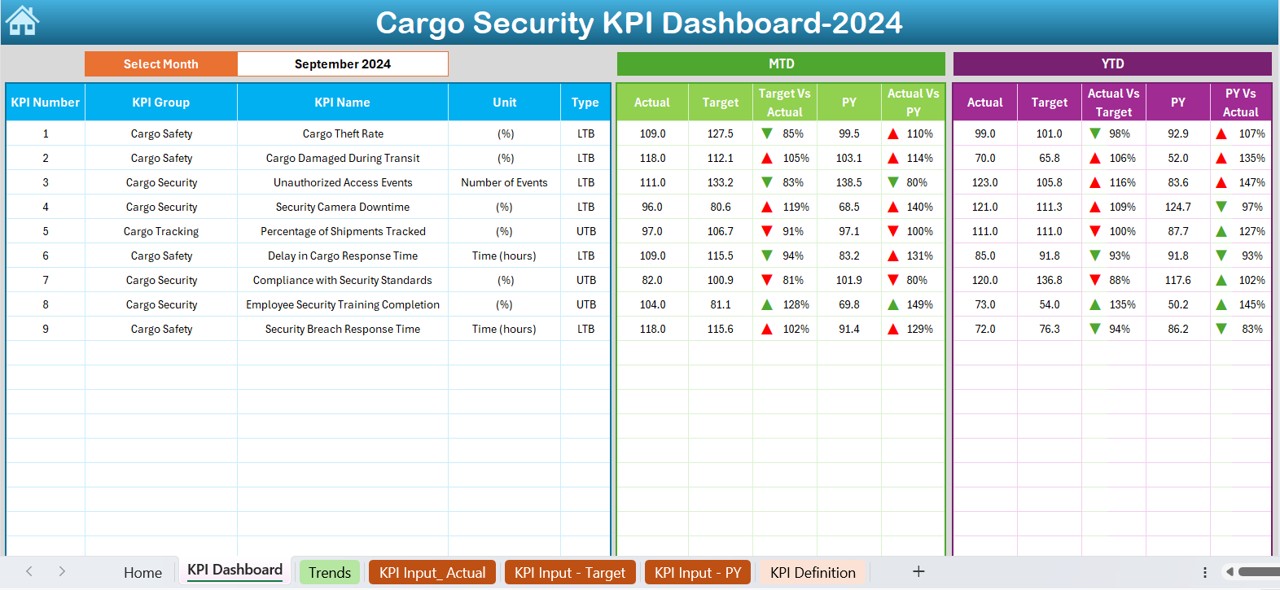
Click to Cargo Security KPI
- This is the heart of the entire template. You can:
- Select the month from a drop-down (cell D3)
- Instantly see updated KPI results
- View both Month-To-Date (MTD) and Year-To-Date (YTD) values
- Compare Actual vs Target and Actual vs Previous Year (PY)
- Use conditional formatting with green/red arrows to visualize performance trends
KPI Trend Sheet Tab
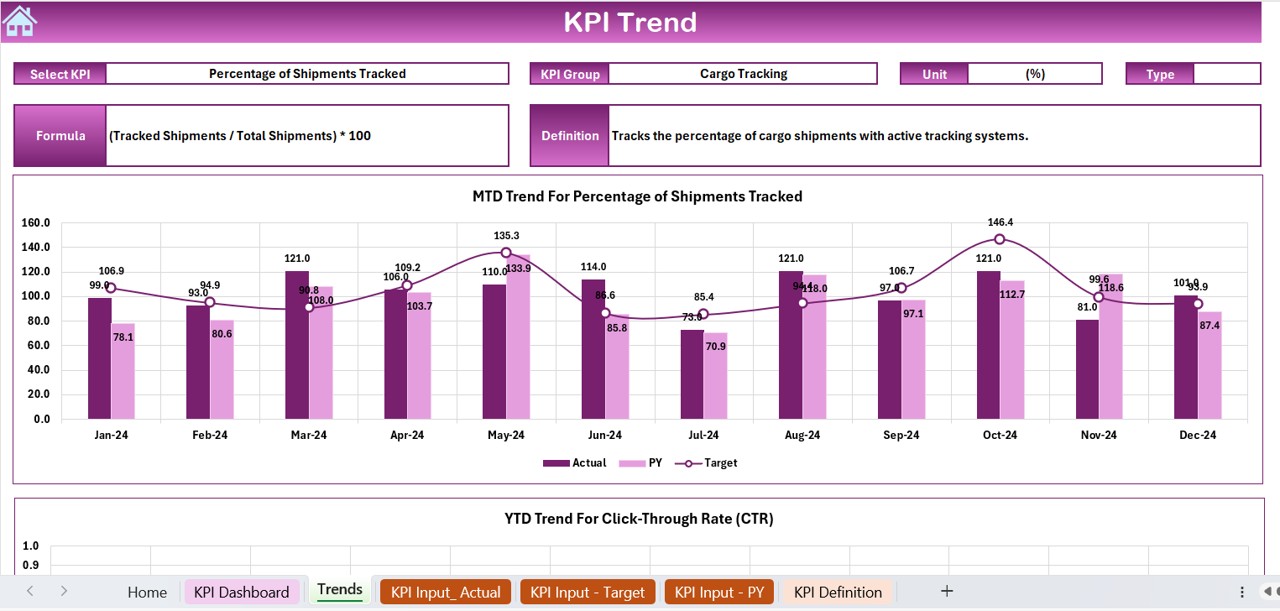
- Want to see the trends over time? This sheet helps you:
- Choose any KPI from the drop-down (cell C3)
- Check its KPI Group, Unit, Type (Upper is Better or Lower is Better), Formula, and Definition
- Visualize MTD and YTD performance with charts
Actual Numbers Input Sheet
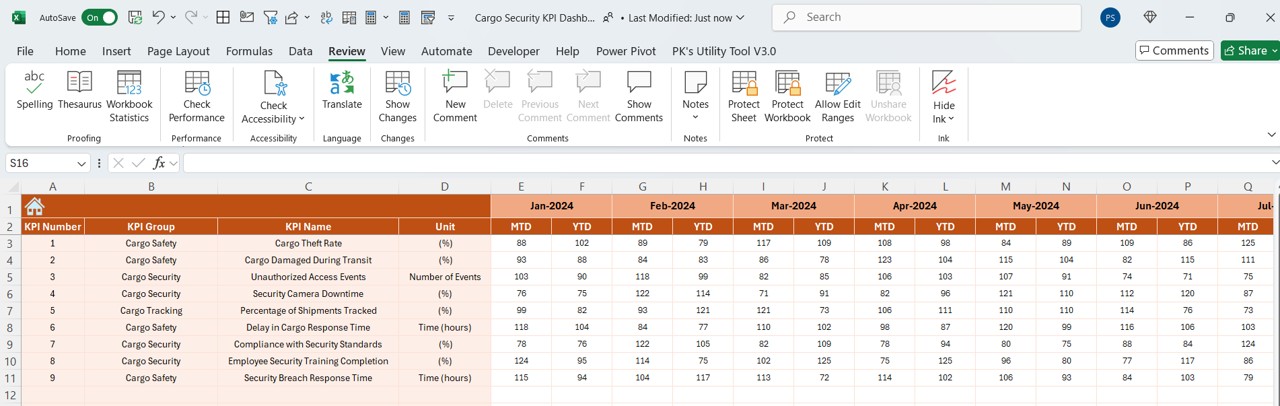
- Here you manually input the actual numbers:
- Both for MTD and YTD
- Based on the selected month (range E1)
- Ensures accurate tracking of real performance
Target Sheet Tab
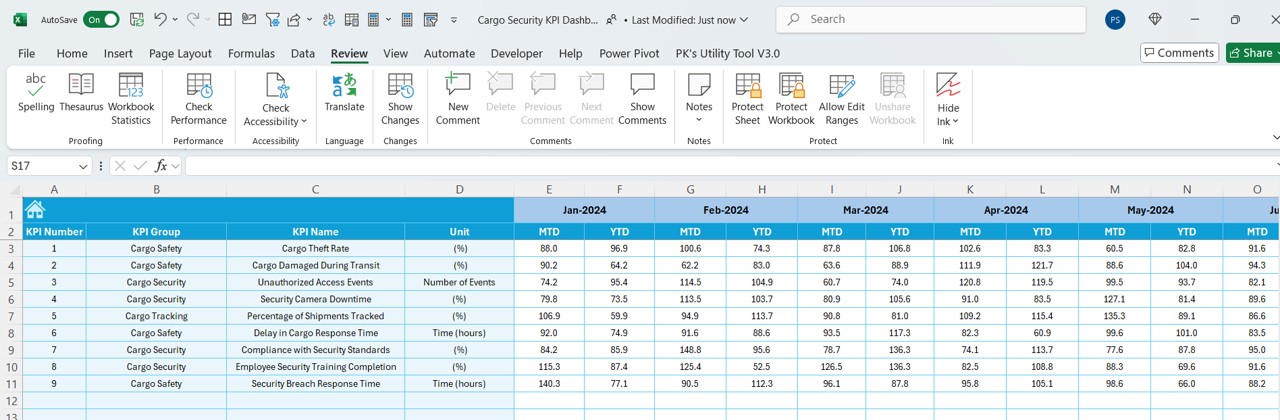
- This is where you define the goalposts. You enter:
- MTD and YTD target values for each KPI
- Monthly goals that align with your security objectives
Previous Year Numbers Sheet
- Want to benchmark your current performance?
- Use this sheet to input last year’s KPI values
- Helps in identifying long-term improvements or regressions
KPI Definition Sheet Tab
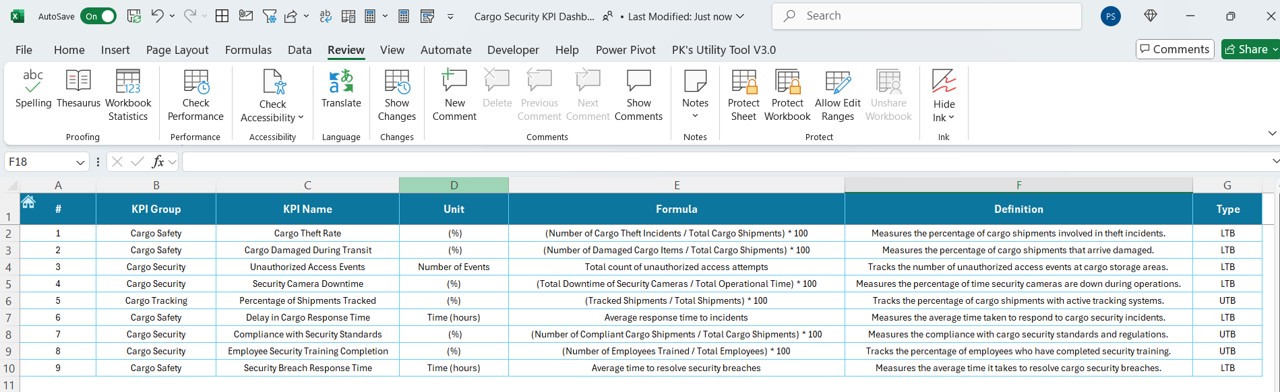
Maintain full clarity by documenting:
- KPI Name
- KPI Group
- Unit
- Formula
- Complete KPI Definition
Advantages of Using a Cargo Security KPI Dashboard in Excel
Using this dashboard gives you clear and measurable advantages:
📊 Improved Decision Making: You always know where you stand and what needs fixing
📊 Quick Data Analysis: Drop-down filters and dynamic charts make insights effortless
📊 Better Accountability: Assign clear KPI ownership to teams or individuals
📊 Higher Security Levels: Spot risks faster and take proactive actions
📊 Cost Savings: Avoid losses due to theft, delays, or damage by tracking trends
🌎 Best Practices for Using the Cargo Security KPI Dashboard
To get the most out of this Excel tool, follow these best practices:
✅ Keep Data Updated: Make sure you regularly update actual, target, and previous year data. Monthly updates are crucial.
✅ Use Clear KPI Definitions: Avoid confusion by clearly defining every KPI. Use the KPI Definition tab wisely.
✅ Compare with Historical Data: Use the Previous Year sheet to find year-on-year changes. This helps you see if security is improving.
✅ Focus on Trends: Don’t just look at a single month’s data. Use the KPI Trend tab to understand patterns.
✅ Involve the Team: Share the dashboard with your logistics, warehousing, and security teams. Everyone should understand the KPIs.
❓ How Do You Select the Right KPIs for Cargo Security?
Choosing the right KPIs is critical. Here are some common and effective security KPIs:
- Theft Incidents per 1000 shipments
- Average Time to Resolve Security Breaches
- Security Compliance Rate
- Damaged Cargo Incidents
- Access Control Breach Count
- CCTV Downtime (Hours)
- Monthly Security Training Completion %
How Often Should You Review Cargo Security KPIs?
You should review KPIs on a monthly basis for MTD performance and quarterly or yearly for YTD trends. Frequent reviews help you act quickly and prevent larger issues.
How to Customize the Dashboard for Your Organization
- Every logistics operation is different. Here’s how you can personalize the dashboard:
- Change KPI Names in the KPI Definition tab
- Update Units based on what you track (e.g., hours, %)
- Adjust Formulas if your calculation method differs
- Modify Targets to suit your company’s goals
- Add Conditional Formatting that matches your internal reporting style
Tips for Visual Appeal and Clarity
- A clean and well-organized dashboard improves readability. You can:
- Use consistent color codes (e.g., green for achieved, red for below target)
- Freeze panes to keep headers visible
- Align charts and tables properly
- Avoid clutter by limiting data to what’s important
Conclusion:
Boost Security with Smart KPI Tracking
A Cargo Security KPI Dashboard in Excel isn’t just a spreadsheet—it’s a smart monitoring system. It helps you stay on top of cargo protection efforts, minimize risks, and deliver safer logistics outcomes.
💬 Frequently Asked Questions (FAQs)
Q1: Who should use the Cargo Security KPI Dashboard?
Answer: Security managers, logistics officers, warehouse teams, and compliance personnel can use it to monitor and improve security performance.
Q2: Can I add more KPIs to the dashboard?
Answer: Yes! You can easily add new KPIs by updating the KPI Definition tab and adjusting the input, target, and dashboard sheets accordingly.
Q3: Is this dashboard suitable for international logistics?
Answer: Absolutely. You can customize the units, KPIs, and formats to fit any regional or international logistics operation.
Q4: Do I need advanced Excel skills to use this?
Answer: Not at all. The dashboard is designed to be user-friendly with drop-downs, auto-calculations, and clear instructions.
Q5: How do I present this dashboard to stakeholders?
Answer: Use the Dashboard and KPI Trend tabs during meetings. The visual charts and conditional formatting make it presentation-ready.
Click to Cargo Security KPI
Visit our YouTube channel to learn step-by-step video tutorials