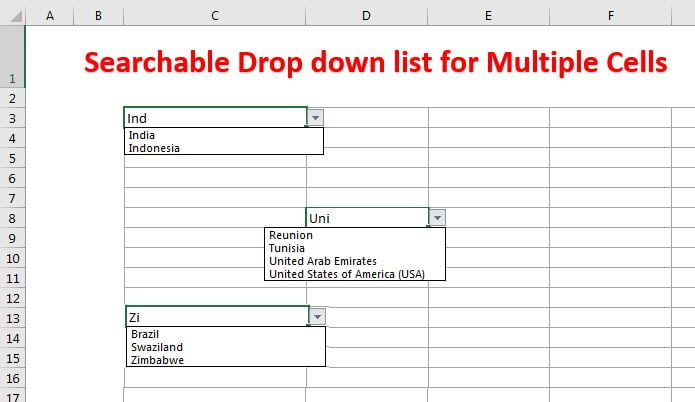
Blogs
Text Join Formula for all Excel Versions
TEXTJOIN Function was introduced with the release of Excel 2016. This is very helpful function to join the multiple Text Join Formula for all Excel Versions into one. The best
RAG Conditional Formatting in Progress Circle Chart
In this article you will learn how to put RAG (Red, Amber and Green) conditional formatting in Progress Circle Chart in Excel. Progress Circle Chart is a beautiful circle chart
Quick Gantt Chart
In this article you will learn how we can create a Gantt Chat quickly in Microsoft Excel. A Gantt Chart is used to show the project plan or project schedule. We
Frequency Analysis Chart in Excel
In this article you will learn how to create a Frequency Analysis chart in Excel. We will create this chart show the headcount % for different sales range. You will
VLOOKUP by cell background color
VLOOKUP is a popular function in Microsoft Excel. It helps users to find and retrieve specific data from a large table or range of data. However, there is a limitation
Yesterday Vs Today Sales Chart
In this article you will learn how to create Yesterday Vs Today Sales Chart in Excel. In this chart we are displaying the green and red arrows. If Today's sale
3D Doughnut Chart for KPI Metrics
In this article you will learn how to create beautiful 3D Doughnut Chart for KPI Metrics like (Service Level, Quality Score, Sales Conversion etc.). 3D Doughnut chart is not default
Weekly Sales Chart in Excel
In today's business world, charts and graphs have become an essential part of data analysis. They help to present complex data in a clear and concise manner, allowing us to