PKComments Off on 
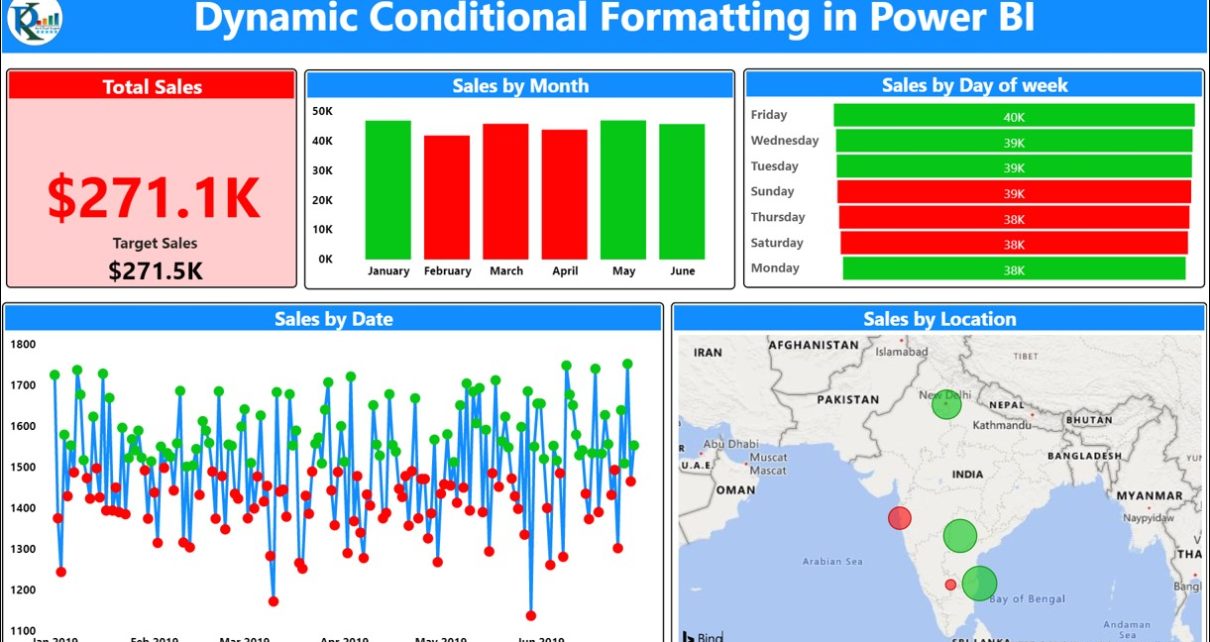
Dynamic Conditional Formatting in Power BI
In this article, we have created a Power BI dashboard with dynamic condition formatting. We have created to measure in Power BI using DAX to create the dynamic Conditional Formatting
PKComments Off on Smart Data Entry form with minimum VBA
In this article, we have a Smart data entry form for candidate information with minimum VBA. We have used Excel formulas, conditional formatting and Form Controls. You can replicate this
PKComments Off on Profit Optimizer in Excel using Multiple Regression
In this article, we have explained how to predict a value using multiple regression Analysis in Microsoft Excel. What is Multiple Regression? Multiple regression is an extension of simple linear
PKComments Off on Correlation Coefficient in Excel
In this article, we have explained how to calculate the Correlation Coefficient in Microsoft Excel. We have explained it using Excel Formula and Data Analysis Add-in. What is Correlation Coefficient?
PKComments Off on Forecasting in Excel using Linear Regression
In this article, we have explained Excel formula and Linear Regress to forecast sales in upcoming month. We have used 1st Jan 2019 to 31st Mar’19 sales data to do
PKComments Off on RandBetweenText Formula in Excel
In this article, we have created a user defined function RandBetweenText Formula in Excel. This function returns random text from the selected range. You can use this function to distribute
PKComments Off on 5 Layered Advanced Doughnut Chart
5 Layered Advanced Doughnut Chart In this article, we have created the 5 Layered Doughnut Chart to display the KPI value up to 500%. We have created two different version
PKComments Off on VBA Application with MS Access Database
In this article, we have create a VBA application with MS Access database using ADODB connectivity. We have created the Rent Management System. We have used VBA user form with
PKComments Off on RAG waffle Chart visualization with Slicer
In this article, we have create a RAG waffle Chart visualization with slicer to display the Red, Amber and Green percentage. We have used Conditional Formatting and linked picture feature
PKComments Off on Fully Functional To-do List in Excel
In this article, we have created a fully functional To-Do list template in Microsoft Excel. We have used VBA to create this template. You can use this template in your
This website uses cookies to improve your user experience, analyze site traffic and serve targeted ads in accordance with our Privacy PolicyACCEPT
Privacy & Cookies Policy
Privacy Overview
This website uses cookies to improve your experience while you navigate through the website. Out of these cookies, the cookies that are categorized as necessary are stored on your browser as they are essential for the working of basic functionalities of the website. We also use third-party cookies that help us analyze and understand how you use this website. These cookies will be stored in your browser only with your consent. You also have the option to opt-out of these cookies. But opting out of some of these cookies may have an effect on your browsing experience.
Necessary cookies are absolutely essential for the website to function properly. This category only includes cookies that ensures basic functionalities and security features of the website. These cookies do not store any personal information.
Any cookies that may not be particularly necessary for the website to function and is used specifically to collect user personal data via analytics, ads, other embedded contents are termed as non-necessary cookies. It is mandatory to procure user consent prior to running these cookies on your website.