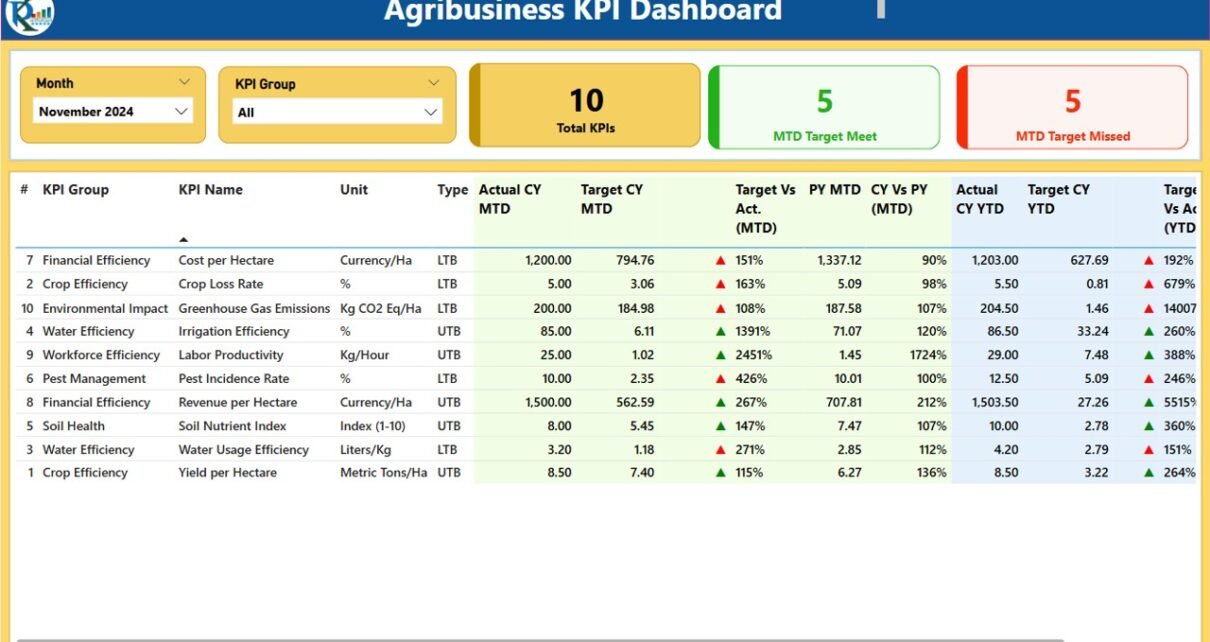
Power BI
This category provides comprehensive tutorials on creating dynamic and insightful visualizations with Power BI. Whether you need to analyze complex data sets or create interactive dashboards, our tutorials will guide you through the process. Each tutorial comes with a free practice file for download and tutorial videos to help you follow along easily. Start your Power BI tutorial now and learn how to create engaging and informative reports. Impress your colleagues and boss with your data visualization and analysis skills by exploring this category today.
Broadcasting KPI Dashboard in Power BI
In today’s data-driven world, tracking Key Performance Indicators (KPIs) is crucial for broadcasting companies. KPIs provide insights into operational efficiency, audience engagement, and overall success. To streamline KPI tracking, Power
Architecture KPI Dashboard in Power BI
In the architecture industry, successful project management goes beyond creativity and design. It requires careful tracking of key performance indicators (KPIs) to ensure that objectives like project timelines, budget adherence,
Interior Design KPI Dashboard in Power BI
Interior design is a dynamic and creative field where success hinges on meeting client expectations, maintaining budgets, and ensuring projects are completed on time. Just as in any other business,
Printing & Publishing KPI Dashboard in Power BI
The Printing & Publishing KPI Dashboard in Power BI is an essential tool for businesses in the printing and publishing industry. It helps track and manage key performance indicators (KPIs)
IT Infrastructure KPI Dashboard in Power BI
In today's data-driven world, organizations depend heavily on their IT infrastructure to support and power their operations. Whether it's network performance, server uptime, or application responsiveness, having a clear view
EdTech KPI Dashboard in Power BI
In the fast-evolving education technology (EdTech) landscape, managing Key Performance Indicators (KPIs) is crucial for understanding the impact of educational initiatives, tracking progress, and ensuring that goals are met. To
Smart Cities KPI Dashboard in Power BI
Smart cities are revolutionizing the way we live, work, and interact with technology. By integrating data and technology, smart cities aim to optimize resources, improve sustainability, and enhance the quality
Solar Energy KPI Dashboard in Power BI
In today’s world, tracking key performance indicators (KPIs) has become an essential part of managing solar energy projects. Whether you are an energy analyst, project manager, or executive, having the
Customer Engagement KPI Dashboard in Power BI
In today's data-driven world, understanding customer engagement is vital for making informed business decisions. With the help of powerful tools like Power BI, companies can build dashboards that allow them