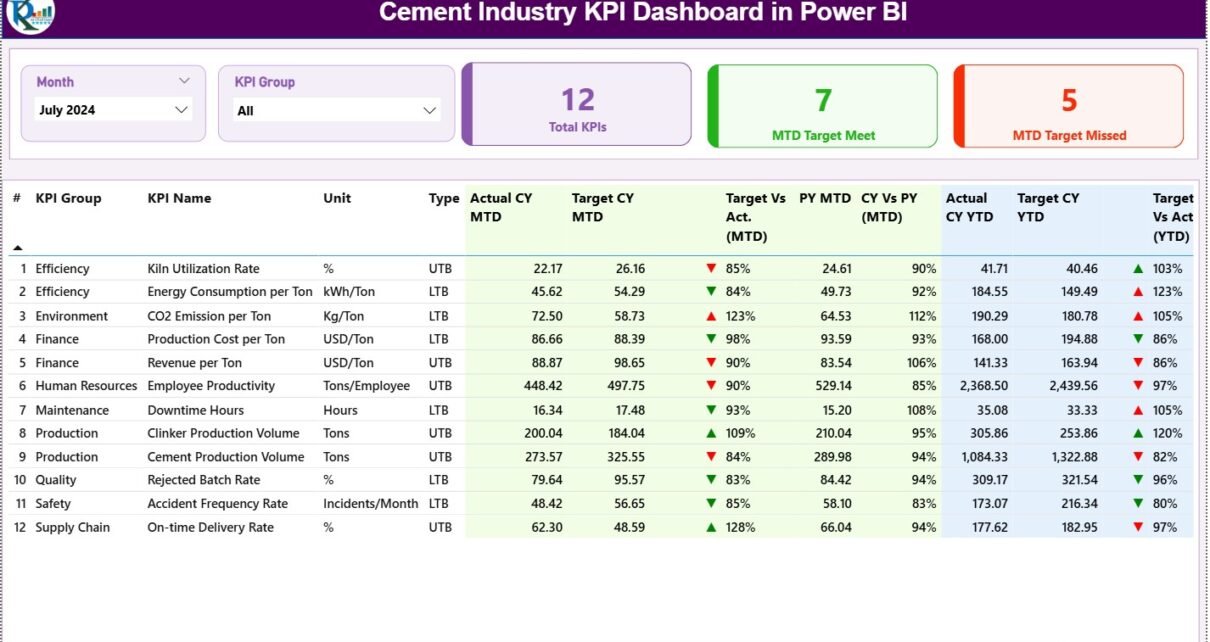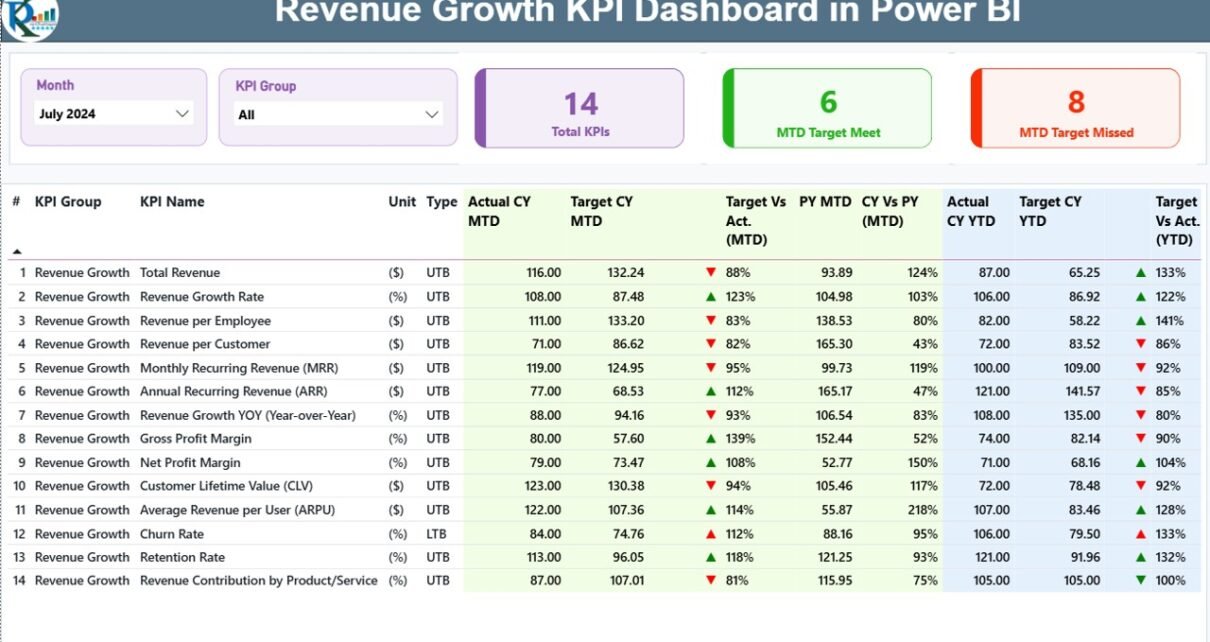
Revenue Growth KPI Dashboard in Power BI
Businesses need fast and clear insights to grow their revenue. Sales change every month, new products enter the market, customer behaviour shifts often, and marketing teams run many campaigns. Because
Transforming Data into Decisions
This category provides comprehensive tutorials on creating dynamic and insightful visualizations with Power BI. Whether you need to analyze complex data sets or create interactive dashboards, our tutorials will guide you through the process. Each tutorial comes with a free practice file for download and tutorial videos to help you follow along easily. Start your Power BI tutorial now and learn how to create engaging and informative reports. Impress your colleagues and boss with your data visualization and analysis skills by exploring this category today.