In today’s highly competitive chemical industry, managing performance and operational efficiency is critical. One of the most effective ways to achieve this is by using a Chemical KPI Dashboard. This tool allows chemical companies to monitor and improve their key performance indicators (KPIs), enabling them to achieve higher productivity, lower costs, and increased profitability.
This article provides a comprehensive overview of the Chemical KPI Dashboard, detailing its key features, advantages, best practices, and opportunities for improvement. We will also walk through the various components of the dashboard, showing how each part contributes to the overall performance management of a chemical business.
What is a Chemical KPI Dashboard?
A Chemical KPI Dashboard is a visual tool designed to track, measure, and monitor the performance of a chemical company’s operations. It consolidates crucial KPIs into an easy-to-read format, allowing managers to quickly assess whether the business is meeting its goals. It helps in making data-driven decisions by providing real-time insights into performance metrics.
With the right set of KPIs, a chemical dashboard ensures that every aspect of the production process, from raw material usage to finished product quality, is running efficiently. In a complex industry like chemicals, where safety, compliance, and cost efficiency are paramount, having such a dashboard is invaluable.
Key Features of the Chemical KPI Dashboard
In this Chemical KPI Dashboard, we’ve created a ready-to-use template designed to streamline performance tracking. Below are the key features:
-
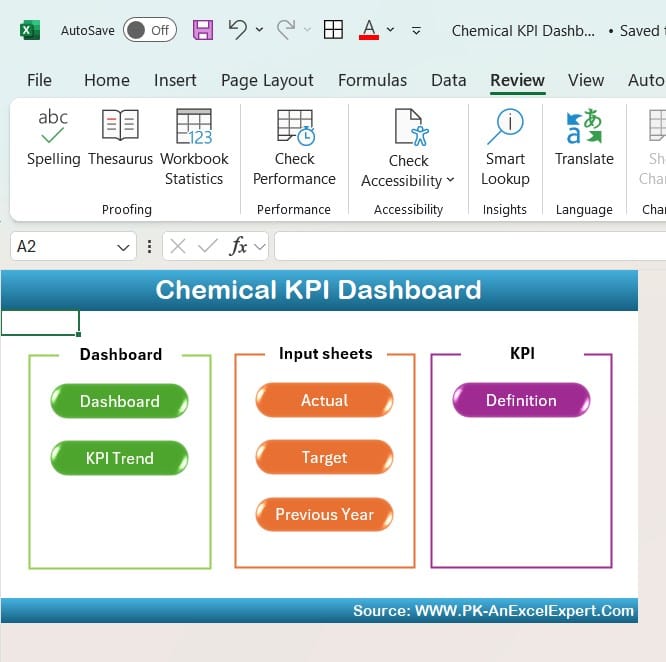
Home Sheet
The Home Sheet serves as an index for the dashboard. It features six buttons that allow you to easily navigate to different sections of the dashboard. This user-friendly interface ensures seamless interaction with the various components of the dashboard.
Click to buy Chemical KPI Dashboard in Excel
-
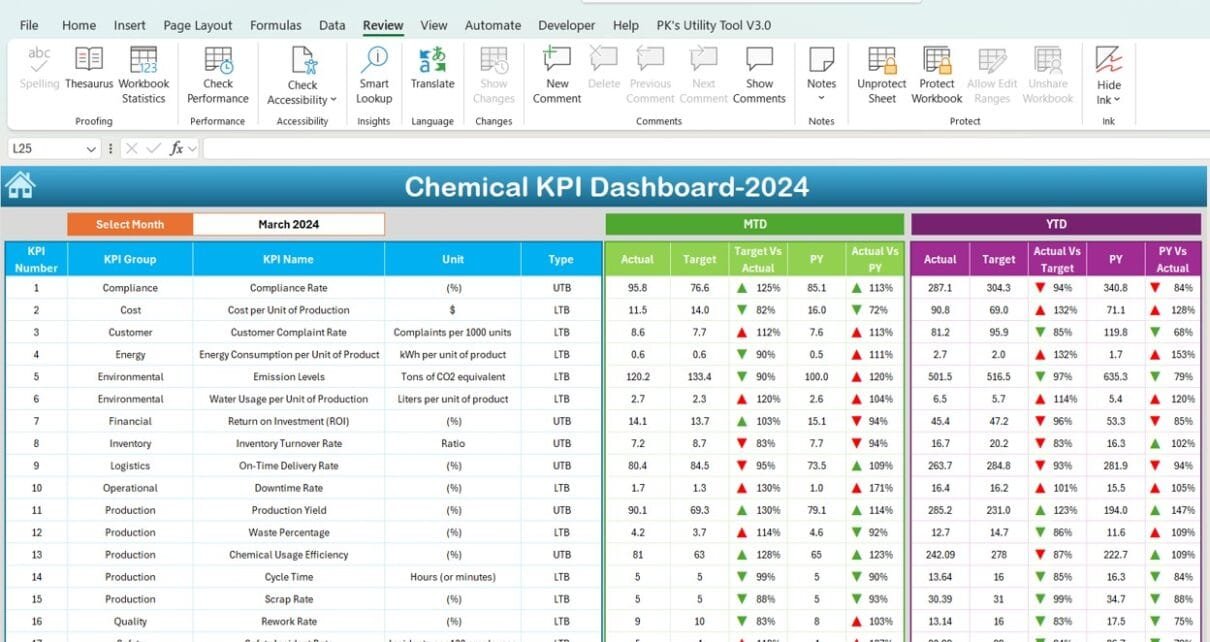
Dashboard Sheet
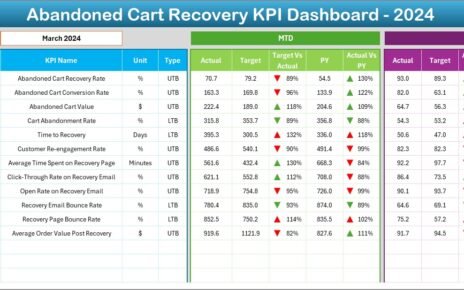
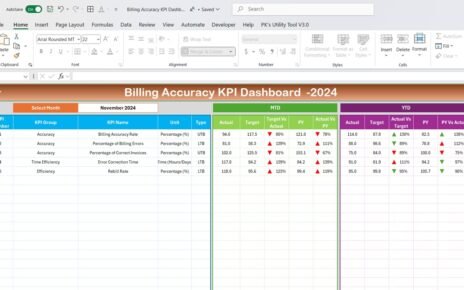
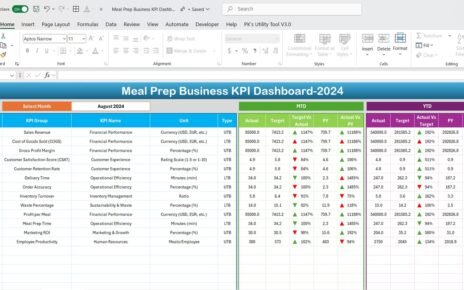
The Dashboard Sheet is the main hub where all critical KPI information is displayed. From here, users can:
Select a month from a dropdown menu in cell D3.
View MTD (Month-to-Date) Actual, Target, and Previous Year data.
Track Target vs. Actual and PY (Previous Year) vs. Actual using conditional formatting, with arrows indicating positive or negative performance trends.
The dashboard also showcases YTD (Year-to-Date) data, ensuring users can track long-term progress.

Click to buy Chemical KPI Dashboard in Excel
-
KPI Trend Sheet
The KPI Trend Sheet allows you to drill down into specific KPIs. By selecting a KPI from a dropdown in C3, you can view:
KPI Group
Unit of the KPI
KPI Type (whether a lower or upper value is better)
The KPI’s formula and definition
This tab provides an in-depth understanding of individual KPIs, helping you focus on areas of improvement.

Click to buy Chemical KPI Dashboard in Excel
-
Actual Numbers Sheet
The Actual Numbers Sheet is where you input real performance data. By changing the month in E1, you can enter the actual MTD and YTD values for each KPI. This data feeds into the dashboard, updating the visualizations in real time.

Click to buy Chemical KPI Dashboard in Excel
-
Target Sheet
In the Target Sheet, you enter the monthly targets for each KPI. Both MTD and YTD targets need to be set here, providing clear benchmarks for performance comparison.

Click to buy Chemical KPI Dashboard in Excel
-
Previous Year Numbers Sheet
The Previous Year Numbers Sheet mirrors the current year’s data structure, but here, you input the actual figures from the prior year. This allows for year-over-year comparisons, giving you insight into long-term performance trends.
-
KPI Definition Sheet
The KPI Definition Sheet contains crucial information about each KPI, including:
- KPI Name
- KPI Group
- Unit
- Formula
- Definition
This section ensures consistency and clarity when it comes to understanding how each KPI is measured.

Click to buy Chemical KPI Dashboard in Excel
Advantages of the Chemical KPI Dashboard
A well-structured Chemical KPI Dashboard offers several advantages that make it indispensable for chemical businesses:
- Enhanced Decision-Making
With real-time data visualization, managers can make more informed decisions faster. The dashboard simplifies complex data into actionable insights, enabling companies to respond quickly to issues like production bottlenecks or safety concerns.
- Improved Performance Tracking
The dashboard provides both MTD and YTD metrics, allowing companies to monitor short-term and long-term progress. This dual approach helps in identifying trends and ensuring that operational goals are being met consistently.
- Increased Efficiency
By having all critical KPIs in one place, the Chemical KPI Dashboard saves time. Teams no longer need to sift through multiple reports or datasets. This consolidated approach streamlines performance tracking and reduces operational inefficiencies.
- Visibility into Compliance and Safety
Safety is a top priority in the chemical industry. The Chemical KPI Dashboard tracks safety incident rates, compliance with regulatory standards, and other key health and safety metrics, ensuring that businesses can prevent costly and dangerous incidents.
- Better Resource Management
The dashboard also tracks energy consumption, raw material usage, and other resource-related KPIs. This helps businesses optimize their use of resources, reducing costs and improving overall operational efficiency.
Best Practices for Using the Chemical KPI Dashboard
To get the most out of your Chemical KPI Dashboard, follow these best practices:
- Regularly Update Data
Ensure that the actual numbers for each KPI are updated regularly, preferably on a monthly basis. This keeps the dashboard accurate and helps you make timely decisions based on current data.
- Set Realistic Targets
The targets you input in the Target Sheet should be both ambitious and achievable. Unrealistic targets can demotivate teams and skew performance evaluations.
- Focus on Actionable KPIs
Not all KPIs are created equal. Focus on those KPIs that directly impact your company’s bottom line. Whether it’s production yield, cost per unit, or safety incident rate, make sure you’re tracking the KPIs that matter most.
- Leverage Historical Data
Use the Previous Year Numbers Sheet to compare current performance against historical trends. This provides valuable context and helps in setting more accurate targets for the future.
- Integrate Conditional Formatting
Conditional formatting, such as the up/down arrows in the Dashboard Sheet, provides immediate visual feedback on performance. Make sure to utilize these formatting tools to quickly identify areas of success or concern.
Opportunities for Improvement in the Chemical KPI Dashboard
No tool is perfect, and the Chemical KPI Dashboard is no exception. Here are some areas where it can be further improved:
- Automation of Data Entry
One of the biggest challenges with KPI dashboards is manual data entry. Automating the input of actual numbers from various systems can reduce errors and save time. Integrating the dashboard with your existing ERP or MES systems could be a game-changer.
- Customization for Specific Roles
While the current dashboard is comprehensive, certain roles in the organization may require more tailored views. For example, plant managers might need more granular data, whereas senior executives might want higher-level summaries. Adding role-specific dashboards would increase its utility.
- Incorporating Predictive Analytics
Incorporating predictive analytics into the dashboard would allow businesses to forecast future performance based on historical data. This would help in planning for resource allocation, production schedules, and potential risks more effectively.
- Mobile Access
As more workplaces shift to mobile solutions, having a mobile-friendly version of the dashboard would enhance its accessibility. Managers could check real-time performance metrics from their smartphones or tablets, even when they’re not in the office.
Conclusion
The Chemical KPI Dashboard is an indispensable tool for any chemical company looking to optimize its operations. It provides a centralized, real-time view of critical performance metrics, enabling businesses to make smarter, faster decisions. With features like conditional formatting, customizable KPI definitions, and YTD/MTD tracking, it offers a comprehensive solution for managing everything from production yield to safety compliance.
By implementing best practices and continually improving the dashboard, companies can maximize its value and drive sustainable growth in an increasingly competitive industry.
Frequently Asked Questions (FAQs)
Q. What are KPIs in the chemical industry?
KPIs, or Key Performance Indicators, are metrics that help track the efficiency and success of various operational processes in a chemical company. Common KPIs include production yield, energy consumption per unit, and safety incident rates.
Q. How does the Chemical KPI Dashboard help improve safety?
The dashboard tracks safety incident rates and compliance with regulatory standards, allowing businesses to identify and mitigate risks before they lead to accidents. This proactive approach helps improve workplace safety.
Q. Can I customize the Chemical KPI Dashboard for my company?
Yes, the dashboard is fully customizable. You can add or remove KPIs based on your specific business needs. You can also adjust the targets and actual values to reflect your company’s performance goals.
Q. Is it possible to automate the data entry in the dashboard?
While the current version of the dashboard relies on manual data entry, it can be automated by integrating it with existing ERP or MES systems. Automation will reduce the risk of errors and save time on manual input.
Visit our YouTube channel to learn step-by-step video tutorials
Click to buy Chemical KPI Dashboard in Excel