In the fast-moving world of insurance, keeping track of claim settlements is essential. A Claim Settlement KPI Dashboard in Excel provides an efficient way to monitor key performance indicators (KPIs) related to claim processing. By using this tool, businesses can improve efficiency, ensure accuracy, and maintain compliance with industry standards.
This article will guide you through the Claim Settlement KPI Dashboard in Excel, its features, benefits, best practices, and commonly asked questions. Let’s get started!
Click to Claim Settlement KPI
What is a Claim Settlement KPI Dashboard?
A Claim Settlement KPI Dashboard is a tool designed to help insurance companies track crucial KPIs, such as claim approval rates, processing time, and payout accuracy. It enables data-driven decision-making, helping businesses streamline their processes and improve customer satisfaction.
Click to Claim Settlement KPI
Key Features of the Claim Settlement KPI Dashboard
This Excel template consists of seven worksheets, each serving a specific function:
Home Sheet
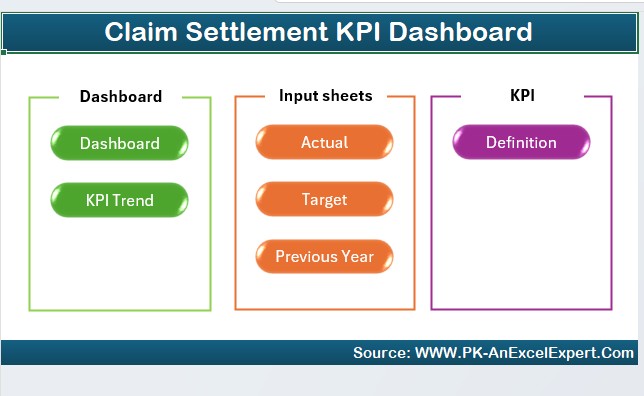
- The Home Sheet acts as the index page, making navigation easy with six buttons that link to the other sheets.
- It enhances usability by allowing users to jump to different sections quickly.
Dashboard Sheet
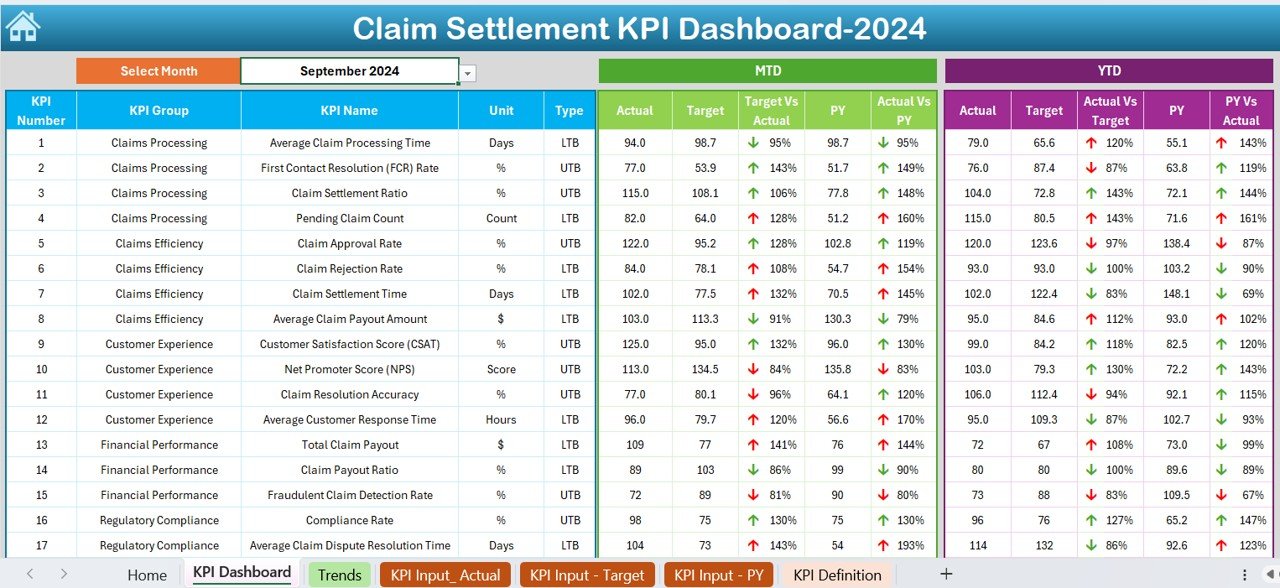
- The Dashboard Sheet is the central hub where all KPIs are displayed in an organized manner.
- Users can choose a specific month from the drop-down menu in cell D3 to filter the data accordingly.
Click to Claim Settlement KPI
The dashboard includes:
- MTD (Month-to-Date) Actual, Target, and Previous Year Data
- Comparison between Target vs. Actual and Previous Year vs. Actual values
- Conditional formatting (up/down arrows) for performance tracking
- YTD (Year-to-Date) Actual, Target, and Previous Year Data with visual indicators
KPI Trend Sheet
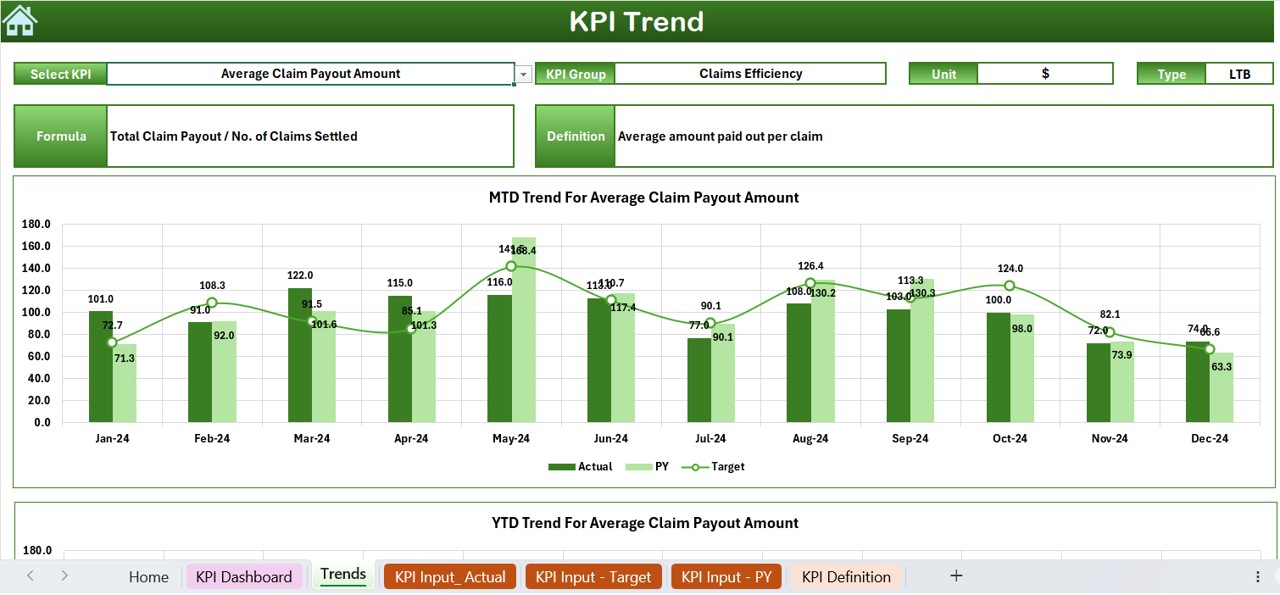
- This sheet allows users to select a KPI Name using the drop-down menu in cell C3.
It provides details like:
- KPI Group
- Unit of Measurement (percentage, count, or duration)
- KPI Type (whether a higher or lower value is better)
- KPI Formula & Definition
- Additionally, it displays a trend chart for MTD and YTD values.
Actual Numbers Input Sheet
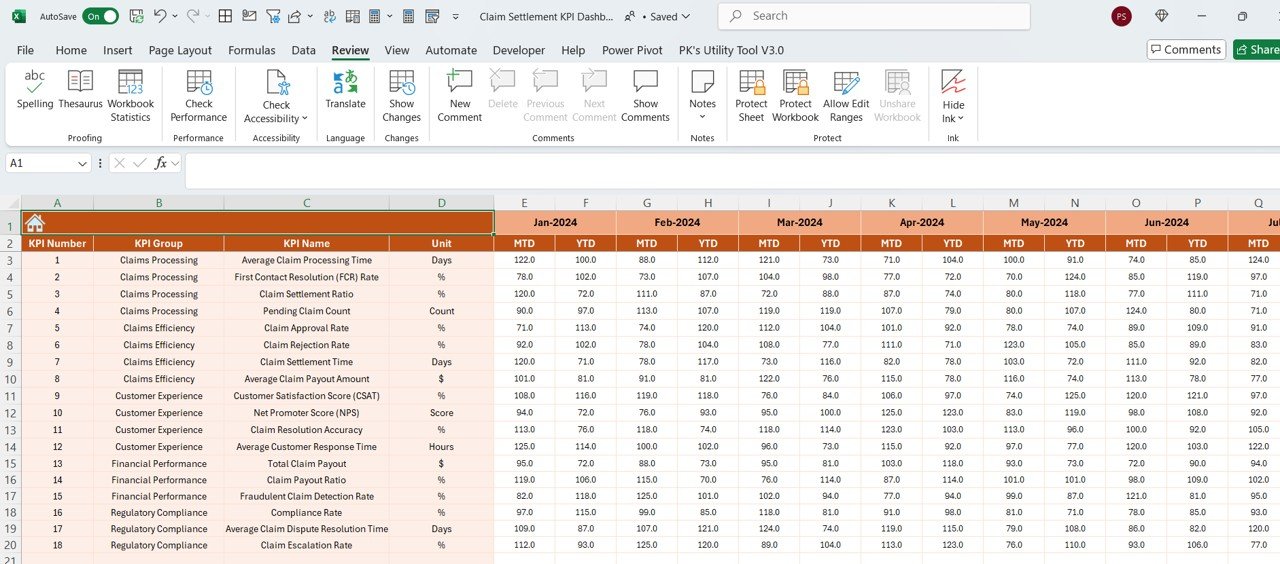
- This sheet is used to input actual values for each month.
- Users can modify the first month in cell E1 to adjust the dataset accordingly.
Click to Claim Settlement KPI
Target Sheet
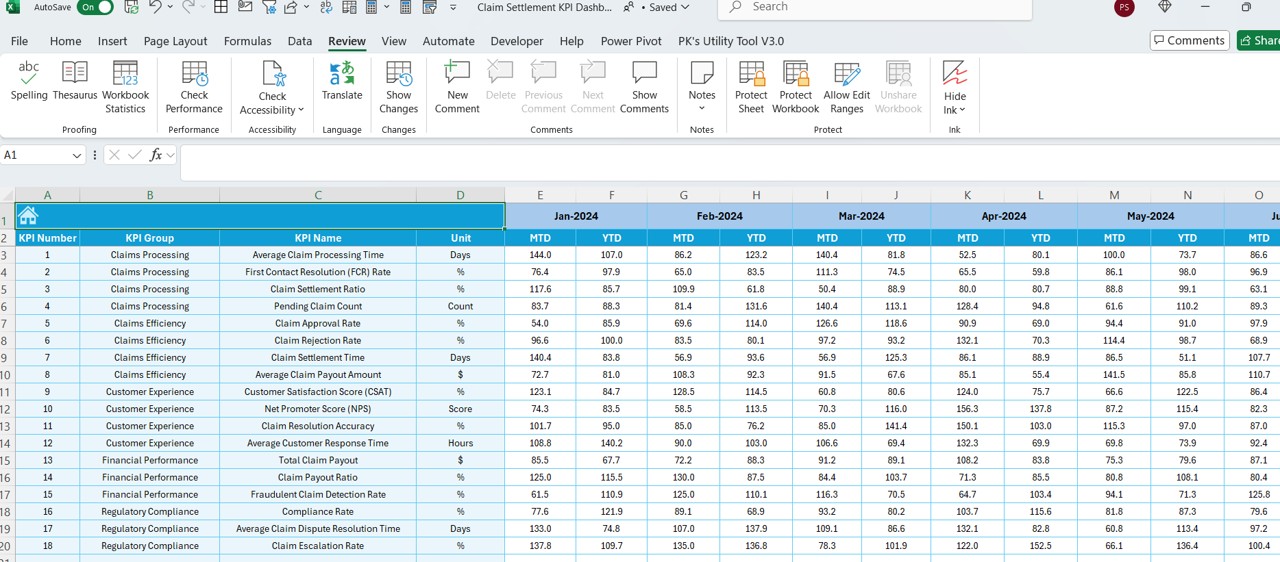
- Here, users can set target values for each KPI, both MTD and YTD.
- It ensures that performance benchmarks are well-defined.
Previous Year Numbers Sheet
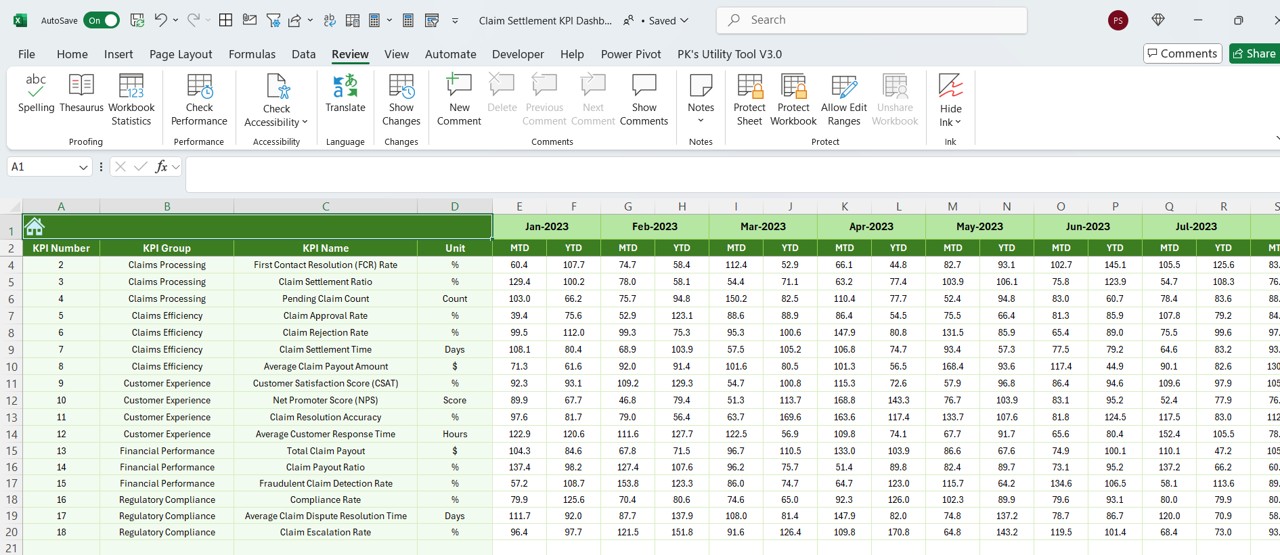
- This sheet stores data from the previous year in the same format as the current year.
- It helps in year-over-year performance analysis.
Click to Claim Settlement KPI
KPI Definition Sheet
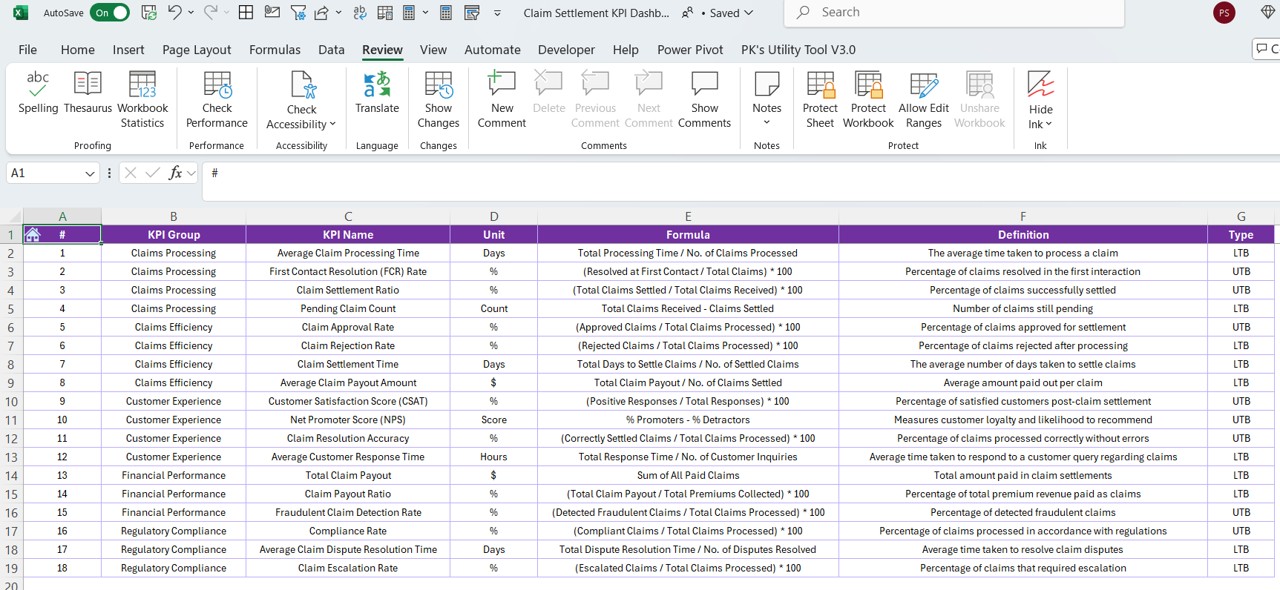
- This sheet provides a structured overview of KPI Names, KPI Groups, Units, Formulas, and Definitions.
- It serves as a reference for users to ensure consistency in data entry.
Why Use a Claim Settlement KPI Dashboard?
Informed Decision-Making
- By tracking KPIs in real time, businesses can make data-driven decisions.
- It helps identify areas needing improvement.
Increased Efficiency
- Reduces the time spent on manual calculations and reporting.
- Automates comparison between actual and target values.
Better Compliance and Accuracy
- Ensures accurate reporting while meeting regulatory requirements.
- Identifies discrepancies in claim processing.
Historical Data Analysis
- Facilitates comparison of past performance with the current year.
- Helps in recognizing trends and seasonal fluctuations.
Customizable and Scalable
- Allows the addition of new KPIs as needed.
- Adapts to changing industry regulations.
Best Practices for Using the Claim Settlement KPI Dashboard
Ensure Accurate Data Entry
- Input correct values in the Actual, Target, and Previous Year sheets.
- Utilize drop-down lists and predefined options to reduce manual errors.
Keep the Dashboard Updated
- Regularly update actual values for MTD and YTD.
- Check formulas and references to ensure accurate calculations.
Use Conditional Formatting for Better Visualization
- Enhances readability by highlighting performance trends.
- Apply color-coded indicators to show areas needing improvement.
Review KPI Trends Frequently
- Keep an eye on the KPI Trend Sheet to detect fluctuations.
- Use the data to refine claim settlement strategies.
Leverage Data for Strategic Planning
- Use historical data trends for forecasting and budgeting.
- Adjust targets based on insights from previous performance.
Click to Claim Settlement KPI
Conclusion
The Claim Settlement KPI Dashboard in Excel is an essential tool for tracking and improving the efficiency of claim processing. It offers real-time insights, simplifies data management, and enhances decision-making. With its customizable features and user-friendly layout, businesses can optimize claim settlements while ensuring accuracy and compliance.
Frequently Asked Questions (FAQs)
Can I customize the Claim Settlement KPI Dashboard?
- Yes, you can add new KPIs by modifying the KPI Definition Sheet.
- Adjust formulas and references to tailor the dashboard to your needs.
- Utilize Excel charts and pivot tables for additional insights.
What are the most important KPIs for claim settlements?
- Common Claim Settlement KPIs include:
- Claim Processing Time (Lower is better)
- Claim Approval Rate (Higher is better)
- Claim Rejection Rate (Lower is better)
- Average Claim Settlement Amount
- Claim Settlement Time
How can I track monthly and yearly performance?
- The Dashboard Sheet allows users to compare MTD and YTD values.
- The KPI Trend Sheet helps in visualizing performance trends over time.
Is the dashboard suitable for different departments?
- Yes! The dashboard is versatile and customizable.
- It can be modified to track financial, HR, or operational KPIs.
How do I maintain data accuracy in the dashboard?
- Regularly update the input sheets.
- Verify formulas and references before making decisions.
- Use drop-downs and pre-set values to minimize errors.
Click to Claim Settlement KPI
Visit our YouTube channel to learn step-by-step video tutorials
View this post on Instagram