A Credit Card KPI Dashboard is an essential tool for tracking key performance indicators (KPIs) related to credit card usage, performance, and customer management. With the rise of data-driven decision-making, businesses, banks, and financial institutions rely on these dashboards to analyze credit card-related data and make informed decisions.
In this article, we’ll explore the features of the Credit Card KPI Dashboard, its components, advantages, and how it can help optimize credit card performance tracking. Let’s dive in!
What is a Credit Card KPI Dashboard?
A Credit Card KPI Dashboard is a visual representation that helps you track the key performance indicators (KPIs) associated with credit card usage and management. This dashboard can be used by financial institutions, businesses, or even individual users who want to evaluate the effectiveness of credit card programs and monitor key data points that impact the bottom line.
The dashboard offers detailed metrics like credit utilization, payment behavior, outstanding balances, and interest rates, helping stakeholders assess trends, risks, and opportunities for improvement.
Key Features of the Credit Card KPI Dashboard
This Credit Card KPI Dashboard is a ready-to-use template, designed for those who need an easy and efficient way to monitor credit card performance. Below are the key features of this KPI Dashboard:
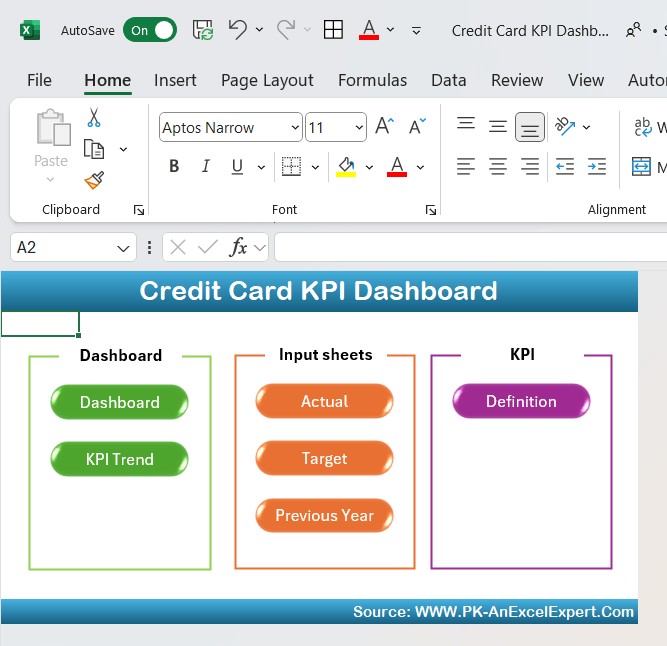
Home Sheet
The Home Sheet serves as the index page, providing six buttons that allow users to quickly jump to the respective sheets. This is the central hub of the dashboard, enabling easy navigation to other sections like the Dashboard Sheet, KPI Trend Sheet, and others.
Click to buy Credit Card KPI Dashboard in Excel
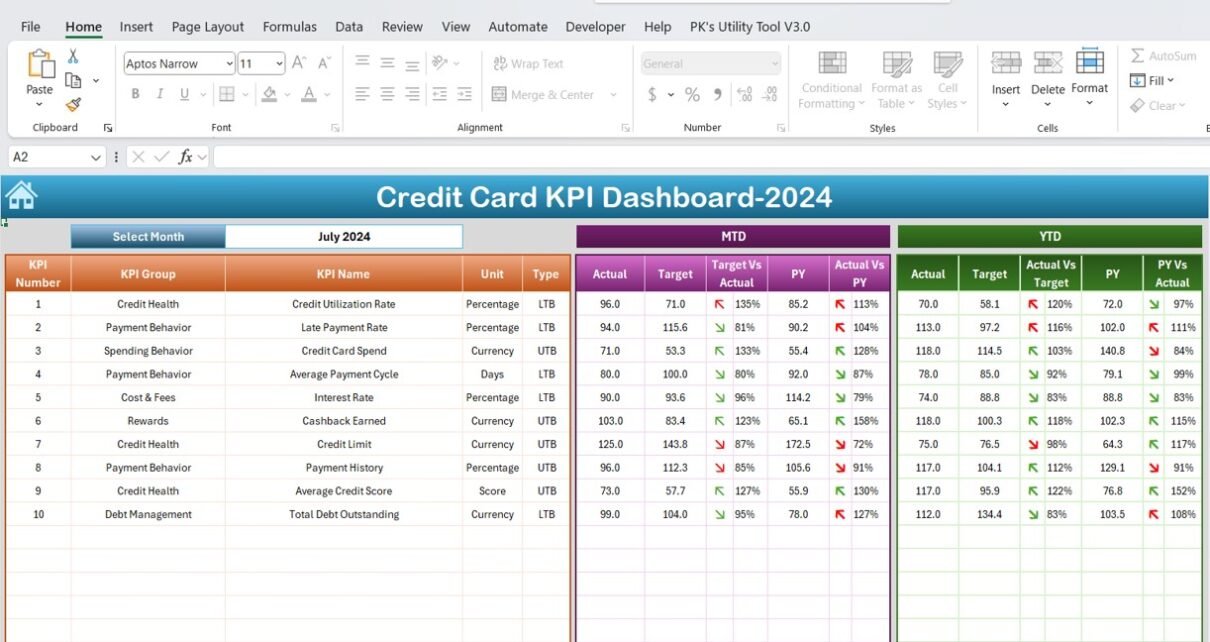
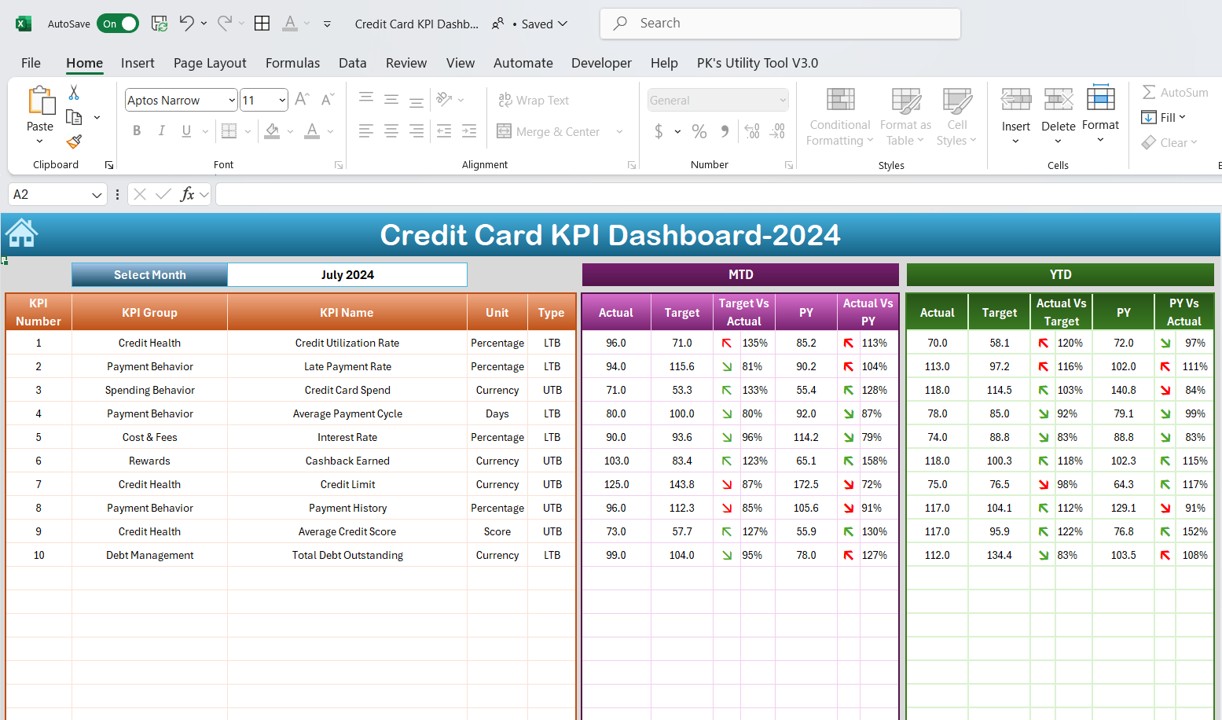
Dashboard Sheet Tab
The Dashboard Sheet Tab is where all KPIs are displayed. You can select the month from a dropdown in cell D3, and the numbers throughout the dashboard will automatically update based on the selected month.
Here, you can view:
Click to buy Credit Card KPI Dashboard in Excel
- MTD (Month-To-Date) Actual, Target, and Previous Year Data with corresponding up and down arrows for Target vs Actual and Previous Year vs Actual comparisons.
- YTD (Year-To-Date) Actual, Target, and Previous Year Data, along with comparisons, helping you track performance throughout the year.
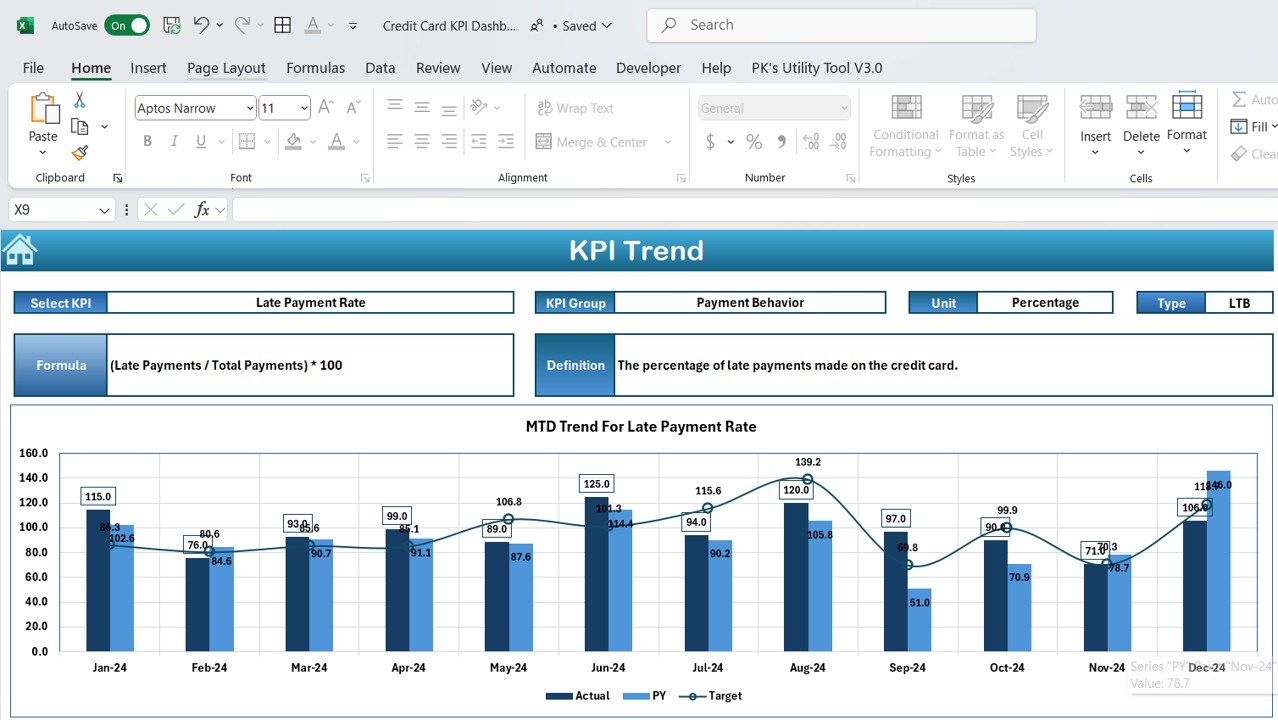
KPI Trend Sheet Tab
In the KPI Trend Sheet Tab, you can select the desired KPI name from a dropdown in cell C3. Here, you’ll find:
- KPI Group
- Unit of KPI
- Type of KPI (whether “Lower the better” or “Upper the better”)
- Formula for KPI calculation
- KPI Definition to ensure clarity on how each metric is measured
Click to buy Credit Card KPI Dashboard in Excel
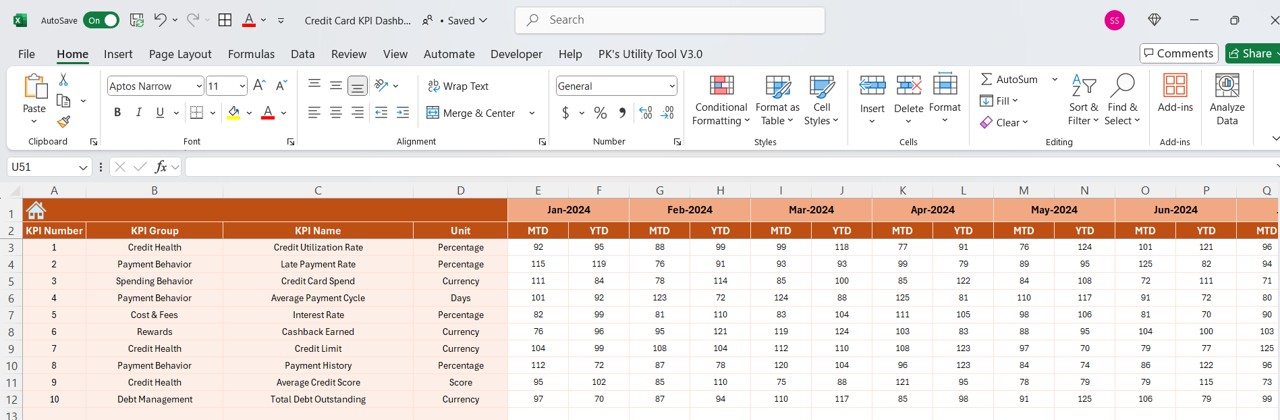
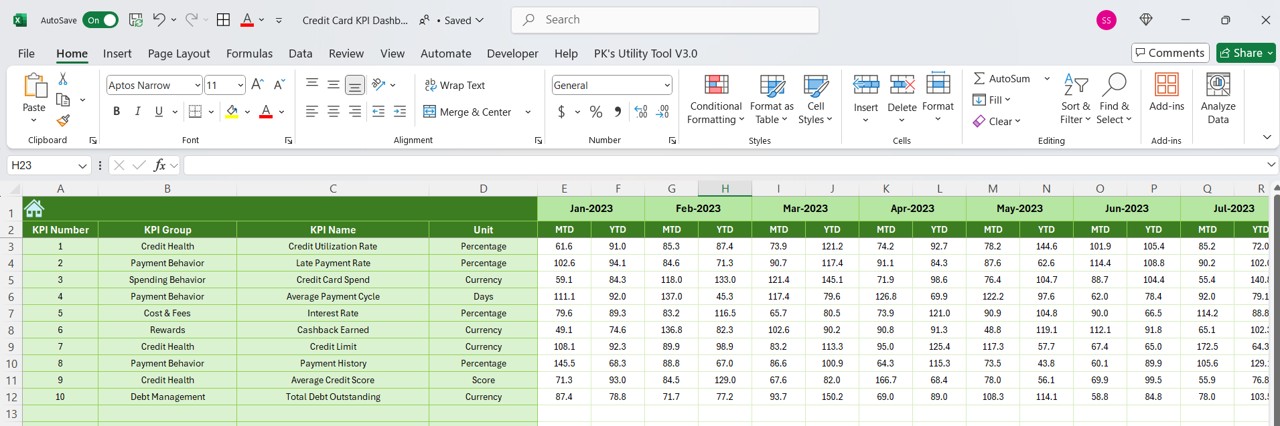
Actual Numbers Sheet Tab
The Actual Numbers Sheet Tab allows you to input the actual numbers for both YTD and MTD performance. By changing the month in cell E1, you can easily track and update the performance metrics for any specific month.
Click to buy Credit Card KPI Dashboard in Excel
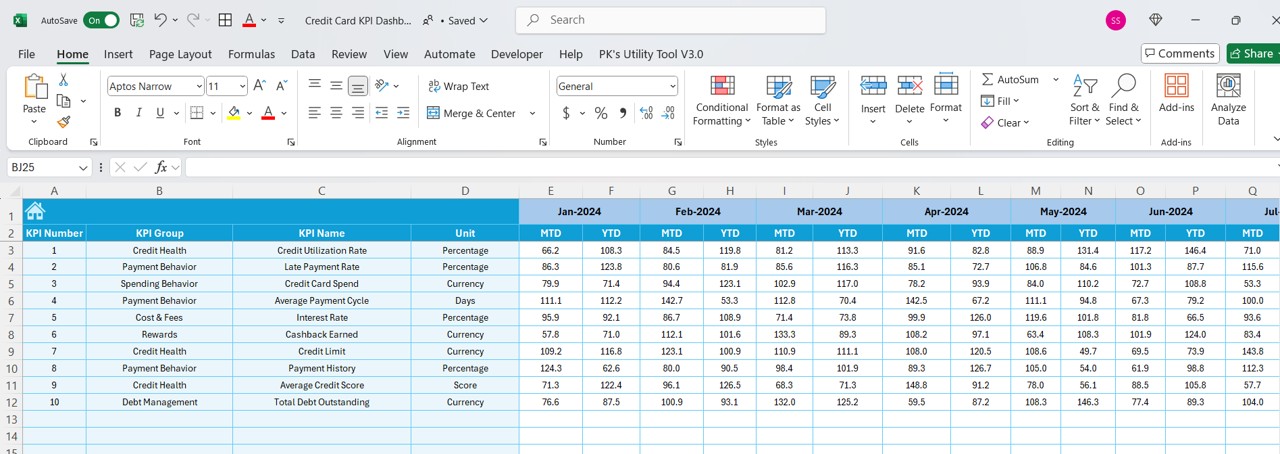
Target Sheet Tab
In the Target Sheet Tab, you enter target values for each KPI for MTD and YTD, allowing for accurate comparison between actual and target performance.
Click to buy Credit Card KPI Dashboard in Excel
Previous Year Numbers Sheet Tab
Here, you can enter data for the previous year, providing a basis for year-over-year comparisons.
Click to buy Credit Card KPI Dashboard in Excel
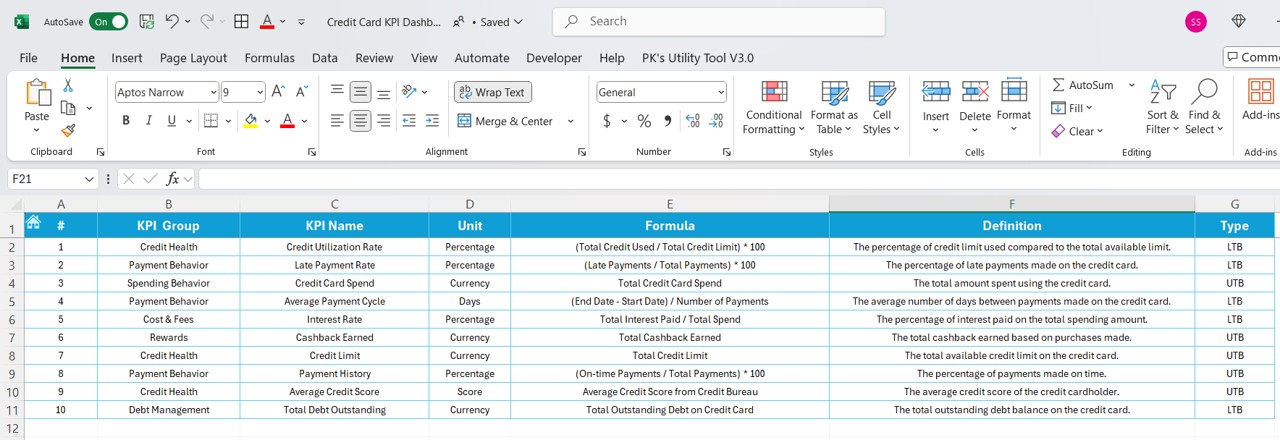
KPI Definition Sheet Tab
This sheet serves as the ultimate reference, where you can input the KPI Name, KPI Group, Unit, Formula, and KPI Definition for all KPIs used in the dashboard.
Click to buy Credit Card KPI Dashboard in Excel
Advantages of the Credit Card KPI Dashboard
The Credit Card KPI Dashboard offers numerous benefits that make it an invaluable tool for businesses and financial institutions:
- Easy Performance Tracking: With all your KPIs in one place, the dashboard makes it easy to monitor credit card performance and identify trends quickly.
- Data-Driven Insights: The dashboard offers real-time, accurate data, enabling you to make better-informed decisions and refine credit card strategies.
- Comparison and Analysis: The ability to compare MTD and YTD performance against targets and previous year data offers critical insights into business trends and financial health.
- Customization: The ability to update the dashboard based on specific months and input actual data ensures the dashboard remains relevant and flexible.
Opportunities for Improvement in Credit Card KPI Dashboard
Despite its effectiveness, there are always opportunities for further enhancements. Here are a few:
- Integration with Real-Time Data: Integrating the dashboard with real-time transactional data from the credit card system can enhance the accuracy of KPIs and provide instant updates.
- Predictive Analytics: Implementing predictive analytics can help forecast future credit card trends based on historical data, making the dashboard even more valuable.
- User Experience Enhancements: Improving the visual elements, such as adding more dynamic charts and graphs, can make the dashboard more intuitive and user-friendly.
Best Practices for the Credit Card KPI Dashboard
To get the most out of your Credit Card KPI Dashboard, here are a few best practices:
- Regularly Update Data: Make sure to update both actual and target data regularly to ensure the dashboard provides the most accurate performance analysis.
- Use Conditional Formatting: Make use of conditional formatting to highlight key trends, such as highlighting negative performance with red and positive performance with green.
- Set Realistic Targets: When entering targets, ensure that they are realistic and based on historical data to prevent unrealistic comparisons.
- Prioritize Key Metrics: Focus on the most relevant KPIs for your business and ensure they are easily accessible from the dashboard.
Conclusion
The Credit Card KPI Dashboard is a powerful tool for tracking and optimizing credit card performance. By providing clear insights into key metrics such as credit utilization, late payments, and cashback earned, this dashboard helps businesses and financial institutions make data-driven decisions. With its user-friendly features, it makes monitoring credit card programs more efficient, ultimately driving better financial outcomes.
Frequently Asked Questions (FAQs)
What is the Credit Card KPI Dashboard used for?
The Credit Card KPI Dashboard is used to track key performance indicators (KPIs) associated with credit card usage and management, such as credit utilization, late payment rates, and total credit card spend.
How does the Credit Card KPI Dashboard help businesses?
By offering real-time insights into performance metrics, the dashboard helps businesses optimize their credit card programs, improve payment behavior, and boost profitability.
Can I customize the KPIs in the Credit Card KPI Dashboard?
Yes, the dashboard can be customized to include additional KPIs based on your business needs or adjust existing metrics to align with your goals.
Is the Credit Card KPI Dashboard suitable for individual users?
While primarily designed for businesses and financial institutions, the dashboard can also be used by individuals who want to track their personal credit card performance.
How can I update the data in the dashboard?
You can update the data by entering actual numbers in the Actual Numbers Sheet Tab, setting targets in the Target Sheet Tab, and entering previous year data in the Previous Year Numbers Sheet Tab
Visit our YouTube channel to learn step-by-step video tutorials