In today’s fast-paced business environment, companies are continuously looking for ways to optimize their sales strategies. One of the most effective ways to do this is through cross-selling. Cross-selling allows businesses to increase their revenue by encouraging customers to purchase related or complementary products. However, tracking the effectiveness of cross-selling efforts can be challenging without a clear system in place.
This is where a Cross-Selling KPI Dashboard becomes invaluable. It provides businesses with the tools and data necessary to measure the performance of their cross-selling strategies. In this article, we will explore the features, key performance indicators (KPIs), advantages, and best practices of a Cross-Selling KPI Dashboard, along with the opportunities for improvement.
What is a Cross-Selling KPI Dashboard?
A Cross-Selling KPI Dashboard is a comprehensive tool that allows businesses to track and evaluate their cross-selling efforts. It uses KPIs (Key Performance Indicators) to measure various aspects of the cross-selling process, such as the conversion rate, the average number of products sold, and revenue generated from cross-selling.
Key Features of the Cross-Selling KPI Dashboard
Our Cross-Selling KPI Dashboard template is a ready-to-use solution designed to help businesses efficiently track their cross-selling performance. It is composed of seven key worksheets that work together to provide a complete overview of your cross-selling activities:
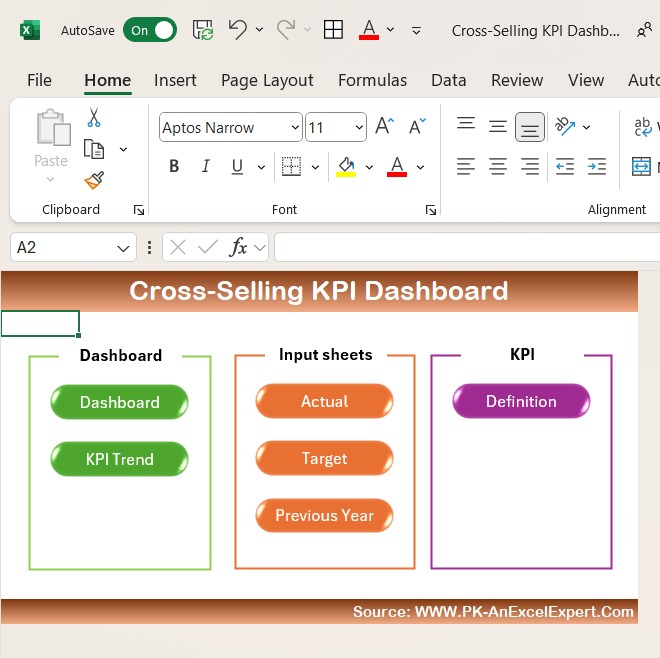
Home Sheet:
This is the index sheet with six buttons to navigate to the respective sheets for easy access to the dashboard.
Click to Purchase Cross-Selling KPI Dashboard in Excel
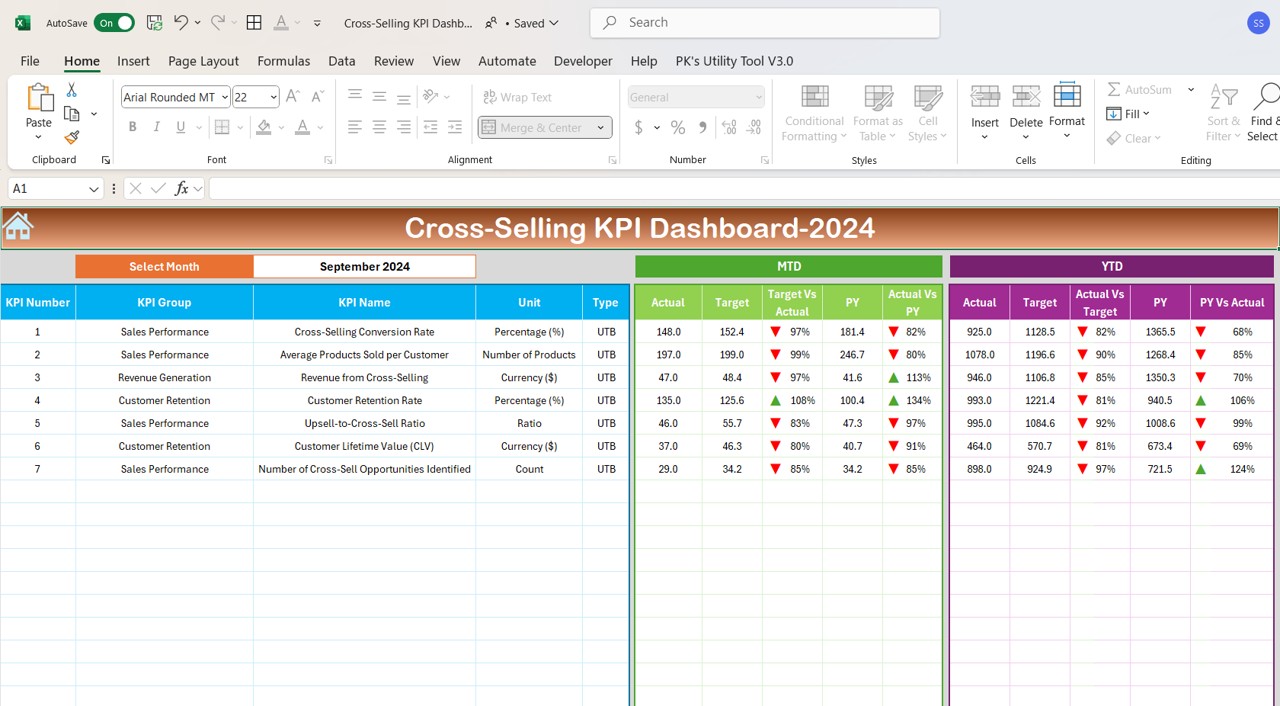
Dashboard Sheet Tab:
This is the main sheet where all key cross-selling information is displayed. The dashboard allows you to select the month from a drop-down menu, and all numbers will automatically update for that selected month.
Key metrics such as MTD (Month-to-Date), YTD (Year-to-Date), and Previous Year (PY) data are shown with visual indicators like up and down arrows through conditional formatting.
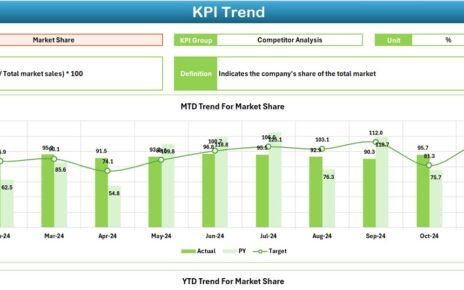
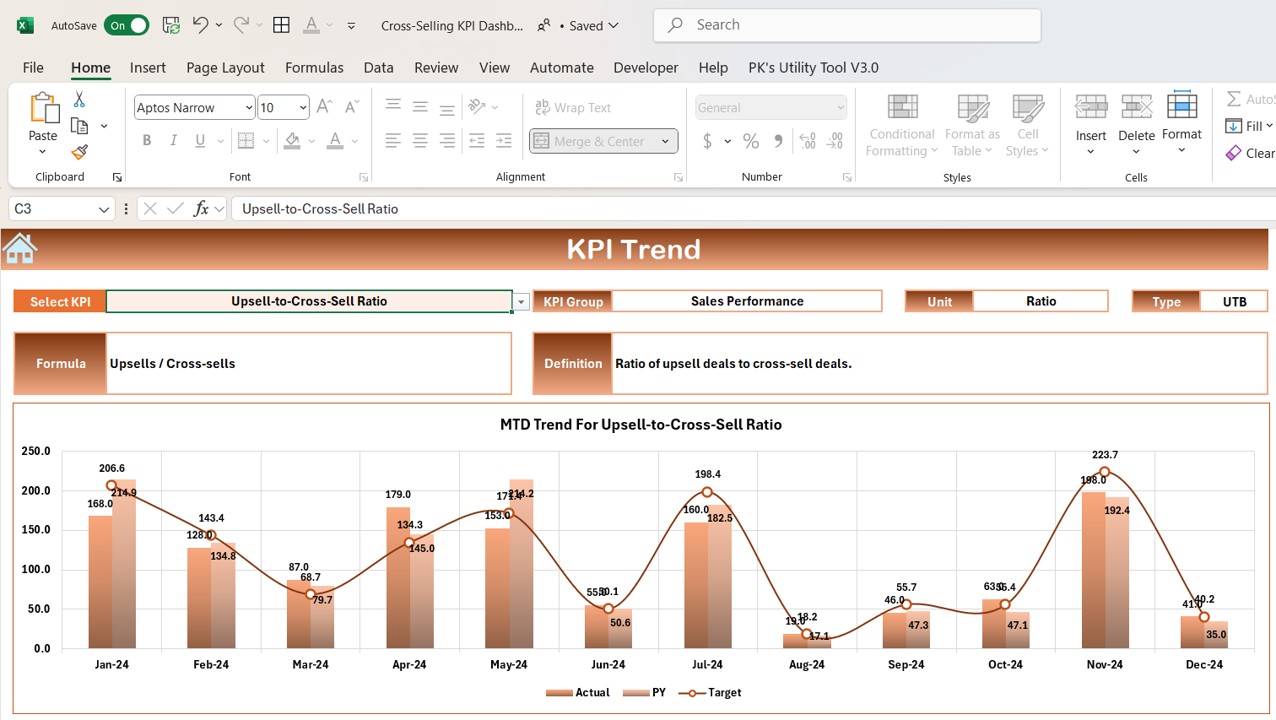
KPI Trend Sheet Tab:
This sheet allows you to select any KPI from a drop-down list. It displays the KPI Group, Unit of KPI, the Type of KPI (whether lower or upper is better), the Formula, and the Definition of the selected KPI.
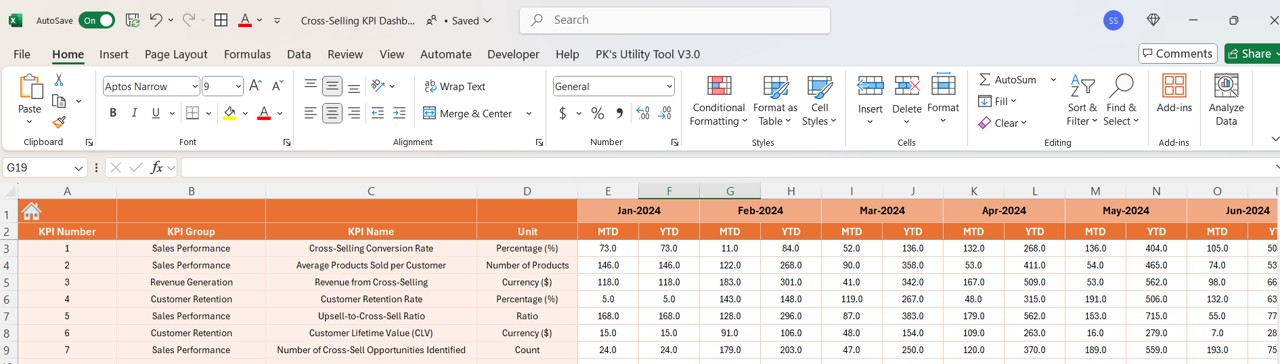
Actual Numbers Sheet Tab:
Enter actual numbers for each KPI (MTD and YTD) for a specific month. The month can be selected using a drop-down menu, and the data will automatically update accordingly.
Target Sheet Tab:
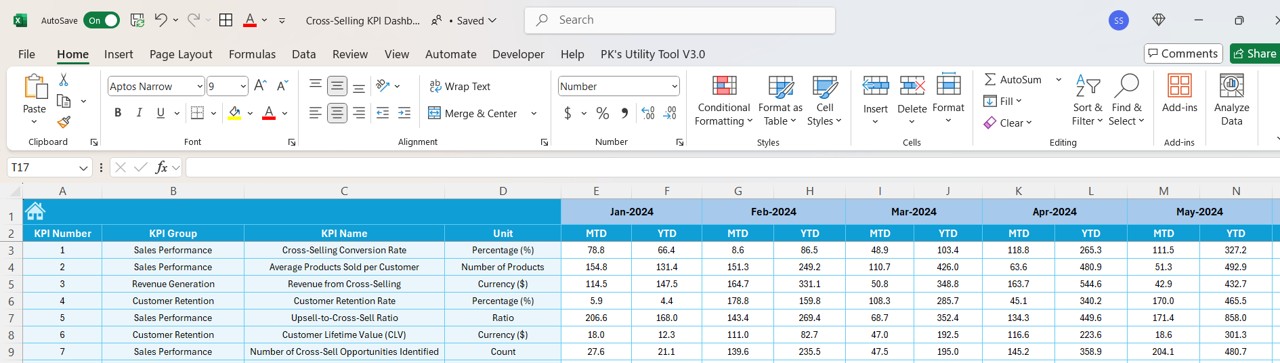
Here, you enter the target numbers for each KPI, including both MTD and YTD values. This helps in comparing actual performance against goals.
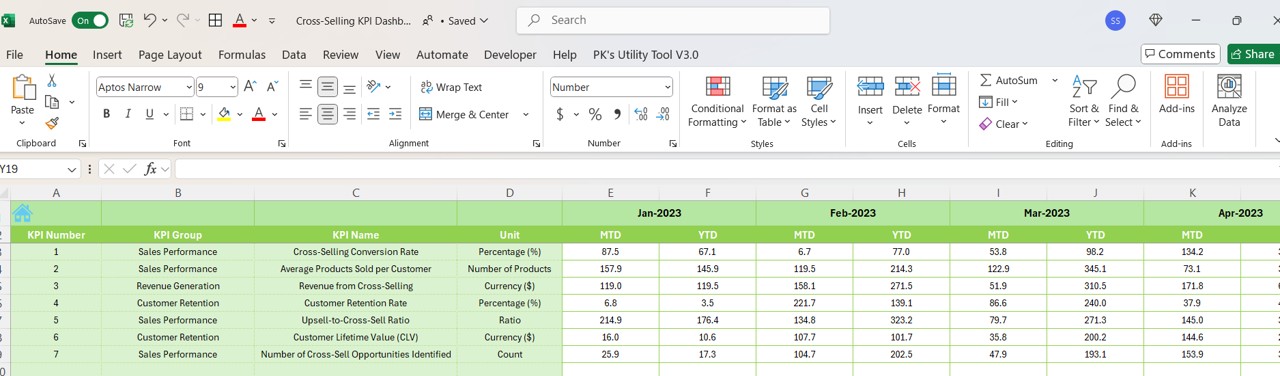
Previous Year Numbers Sheet Tab:
Enter the numbers for the previous year to compare with current year performance, enabling insightful year-over-year analysis.
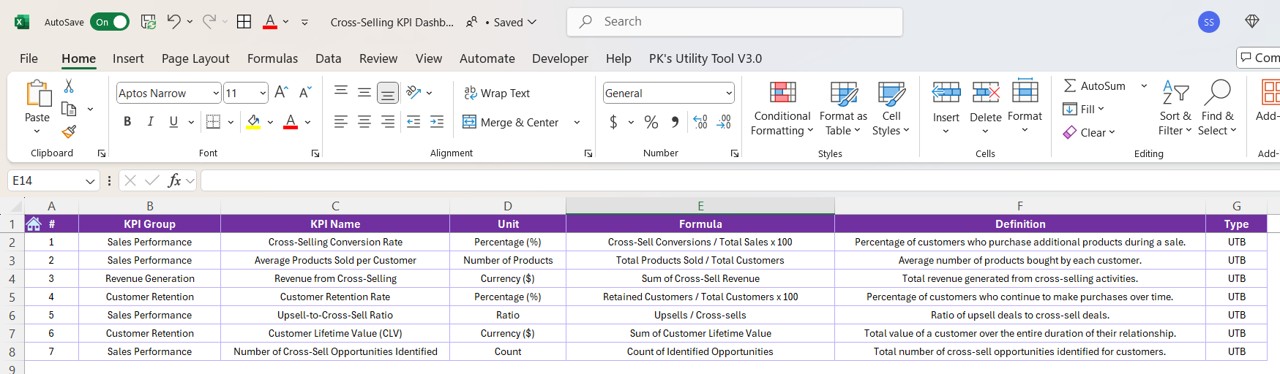
KPI Definition Sheet Tab:
This sheet contains the KPI Name, KPI Group, Unit, Formula, and Definition of each KPI used in the dashboard.
Click to Purchase Cross-Selling KPI Dashboard in Excel
Advantages of the Cross-Selling KPI Dashboard
Using a Cross-Selling KPI Dashboard offers numerous benefits that can enhance your business’s sales performance. Here are the key advantages:
-
Improved Decision Making: With real-time data and detailed KPIs, decision-makers can make more informed choices about their sales strategies.
-
Increased Revenue: By tracking cross-selling efforts closely, businesses can identify high-performing strategies and focus their resources on the most effective methods.
-
Better Resource Allocation: The dashboard highlights areas that need attention, helping businesses allocate resources more effectively for maximum return.
-
Improved Customer Satisfaction: Cross-selling allows businesses to offer more relevant products to their customers, improving customer experience and loyalty.
-
Enhanced Reporting: The dashboard’s clear and easy-to-understand visuals make reporting more effective and accessible for stakeholders.
Opportunities for Improvement in the Cross-Selling KPI Dashboard
While the Cross-Selling KPI Dashboard is a powerful tool, there is always room for improvement. Here are some opportunities to optimize its usage:
-
Integration with CRM Systems: By integrating the dashboard with a Customer Relationship Management (CRM) system, businesses can automatically pull data to track customer interactions and sales trends in real-time.
-
Adding More KPIs: The dashboard can be enhanced by adding additional KPIs such as customer feedback or sales rep performance, providing a more holistic view of the cross-selling process.
-
Enhanced Data Visualization: Including more advanced visual elements like interactive graphs or heat maps could further enhance the dashboard’s ability to convey insights clearly.
-
Predictive Analytics: Adding predictive analytics could help businesses forecast trends and customer behavior, improving the accuracy of sales strategies.
Best Practices for the Cross-Selling KPI Dashboard
To get the most out of your Cross-Selling KPI Dashboard, follow these best practices:
-
Regularly Update Data: Make sure that the actual and target data are updated frequently to ensure the dashboard reflects the latest performance.
-
Set Realistic Targets: Ensure the target values for each KPI are realistic and based on historical data to avoid overestimating potential sales.
-
Monitor Trends Over Time: Regularly check the KPI Trend Sheet to monitor the long-term trends of your cross-selling efforts, rather than focusing solely on short-term data.
-
Customizable Views: Customize the dashboard to focus on the KPIs that are most relevant to your business goals, making it easier to monitor performance.
-
Leverage Data for Strategy Refinement: Use the data from the dashboard to refine your cross-selling strategies continuously, identifying high-performing products and customers.
Frequently Asked Questions (FAQs)
1. What is a Cross-Selling KPI Dashboard?
A Cross-Selling KPI Dashboard is a tool used by businesses to track and measure the effectiveness of their cross-selling efforts using various KPIs like conversion rate, revenue generated, and customer retention.
2. Why is Cross-Selling Important for My Business?
Cross-selling helps increase revenue by encouraging customers to buy complementary or related products, improving both customer satisfaction and overall sales.
3. How Do I Use the Cross-Selling KPI Dashboard?
To use the dashboard, simply input the required data for MTD and YTD values in the respective sheets. The dashboard will automatically update to reflect real-time performance metrics, providing valuable insights.
4. What KPIs are Included in the Cross-Selling KPI Dashboard?
The dashboard includes KPIs such as Cross-Selling Conversion Rate, Revenue from Cross-Selling, Customer Retention Rate, and Upsell-to-Cross-Sell Ratio.
5. How Often Should I Update the Data in the Dashboard?
It’s important to update the data regularly (monthly or quarterly) to ensure the dashboard reflects the most accurate and up-to-date performance metrics.
Conclusion
The Cross-Selling KPI Dashboard is an essential tool for businesses aiming to optimize their cross-selling strategies and boost sales. By tracking key KPIs and leveraging data to refine strategies, businesses can increase revenue, improve customer satisfaction, and make more informed decisions. Implementing best practices and continuously monitoring performance can help businesses maximize the effectiveness of their cross-selling efforts.
Visit our YouTube channel to learn step-by-step video tutorials
View this post on Instagram