In today’s data-driven world, businesses need a clear understanding of their customer demographics to make informed marketing and operational decisions. A Customer Demographics KPI Dashboard in Excel simplifies the process of tracking, analyzing, and visualizing key performance indicators (KPIs) related to customer data.
This article will guide you through the essential features of this Customer Demographics KPI Dashboard, how it works, its advantages, and best practices for implementation.
Click to Customer Demographics KPI
Key Features of the Customer Demographics KPI Dashboard
This ready-to-use Excel dashboard consists of seven key worksheets, each designed to streamline KPI management and reporting. Below is a breakdown of each sheet and its purpose:
Home Sheet
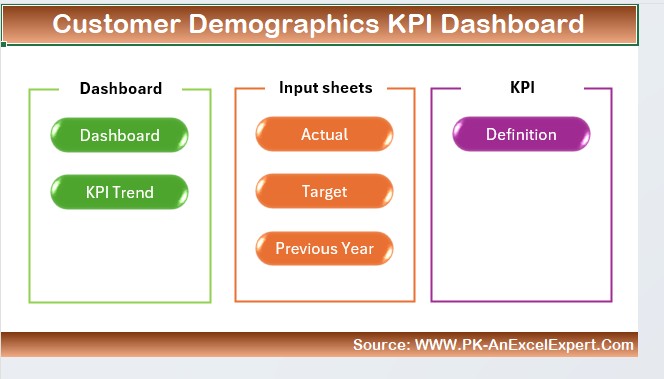
- This serves as the index page of the dashboard.
- It includes six navigation buttons that allow users to jump directly to different sheets.
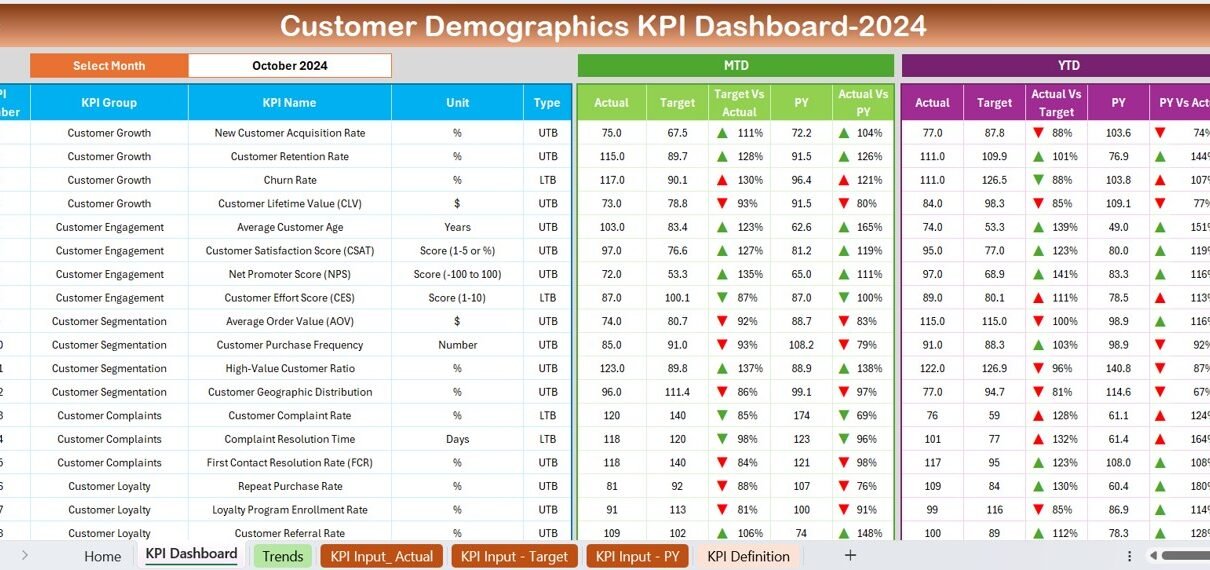
Dashboard Sheet
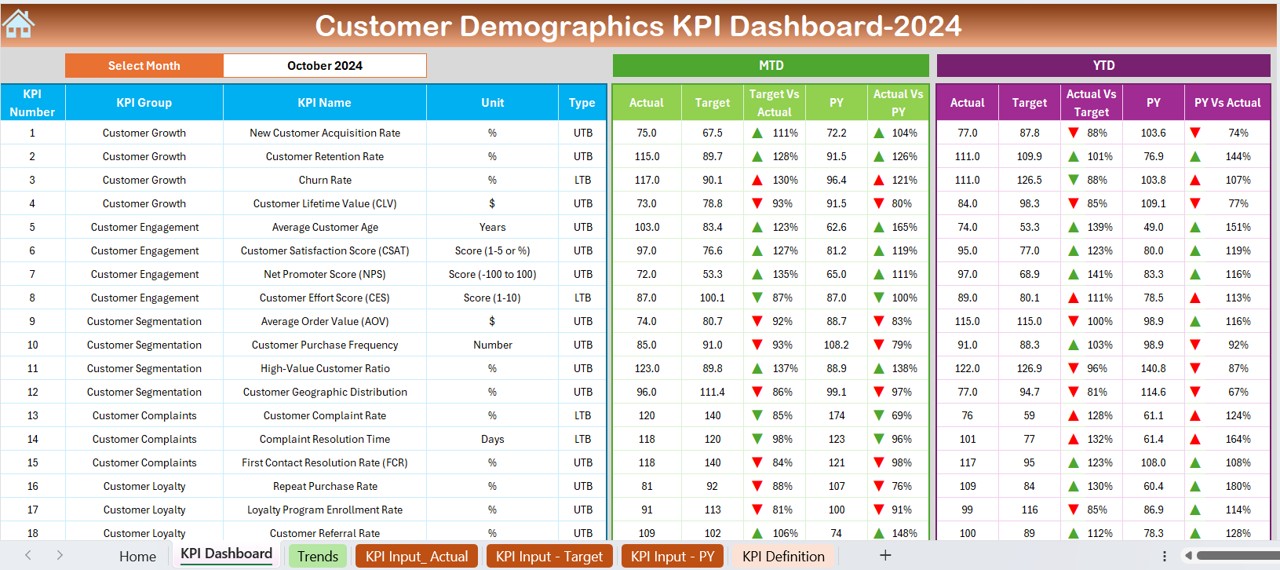
- This is the main dashboard, displaying all customer demographic KPIs.
- Users can select the desired month from a drop-down menu (D3), and the dashboard automatically updates.
Key metrics displayed:
- MTD (Month-To-Date) Actual, Target, and Previous Year Data
- YTD (Year-To-Date) Actual, Target, and Previous Year Data
- Comparison with Target vs. Actual & Previous Year vs. Actual, with conditional formatting up/down arrows.
Click to Customer Demographics KPI
KPI Trend Sheet
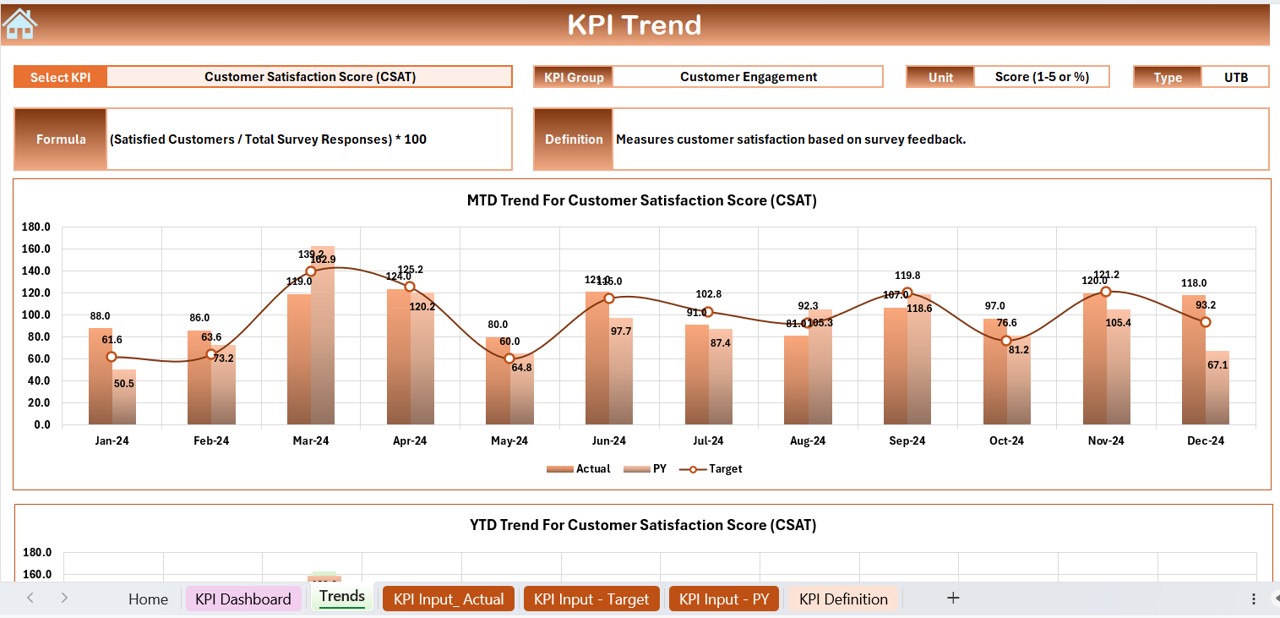
- Allows users to select a KPI name (C3 drop-down list).
- Displays:
- KPI Group
- Unit of KPI
- Type of KPI (Lower is Better or Upper is Better)
- Formula of KPI
- Definition of KPI
- MTD and YTD Trend Charts for Actual, Target, and Previous Year numbers.
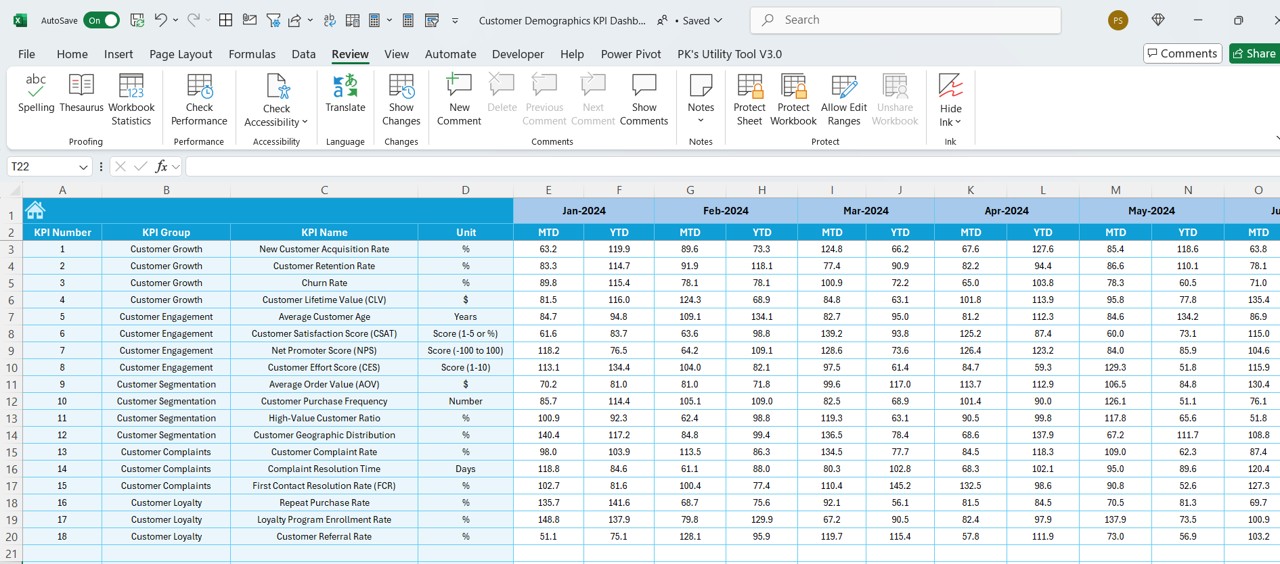
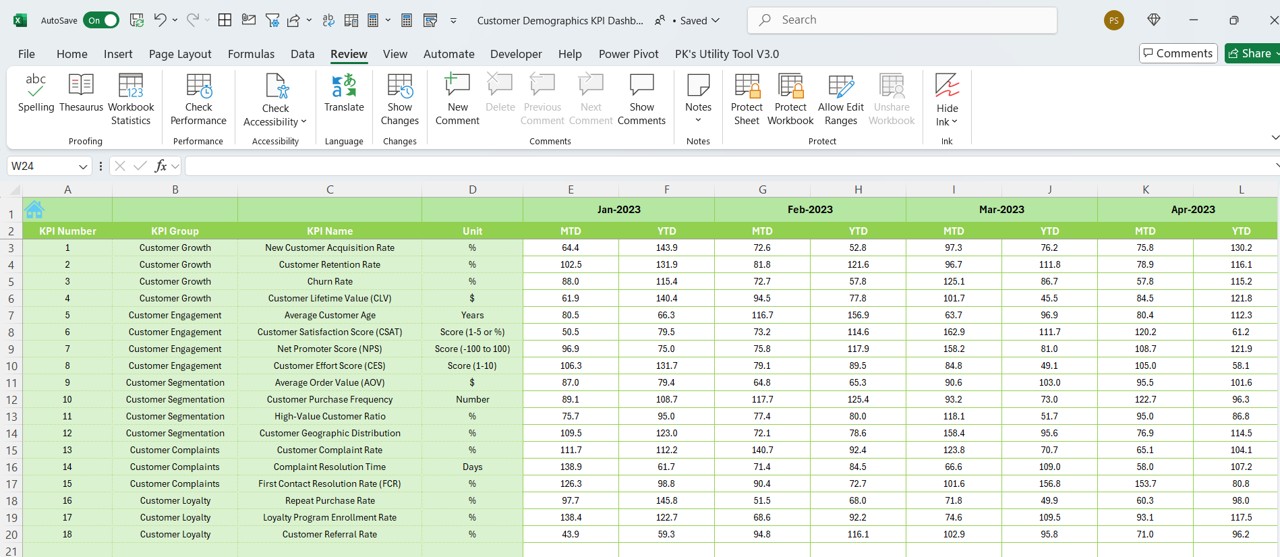
Actual Numbers Input Sheet
- Users enter actual customer demographic data for MTD and YTD.
- The month can be modified in E1 by entering the first month of the year.
Target Sheet
- Users input monthly target numbers for each KPI (MTD and YTD).
Click to Customer Demographics KPI
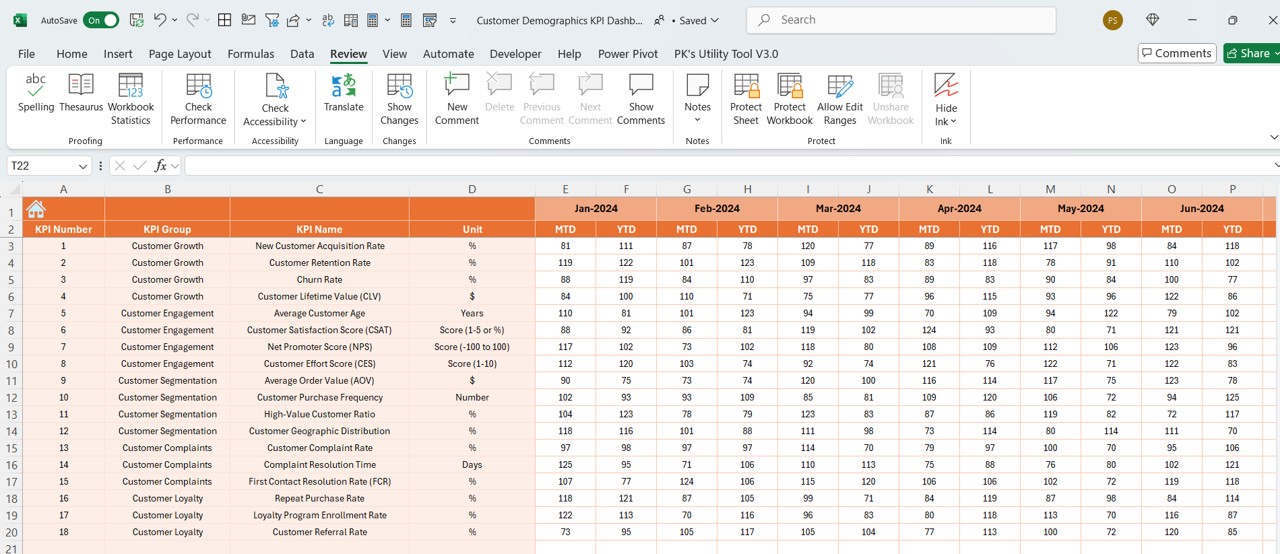
Previous Year Number Sheet
- Stores previous year data in the same format as the current year data.
KPI Definition Sheet
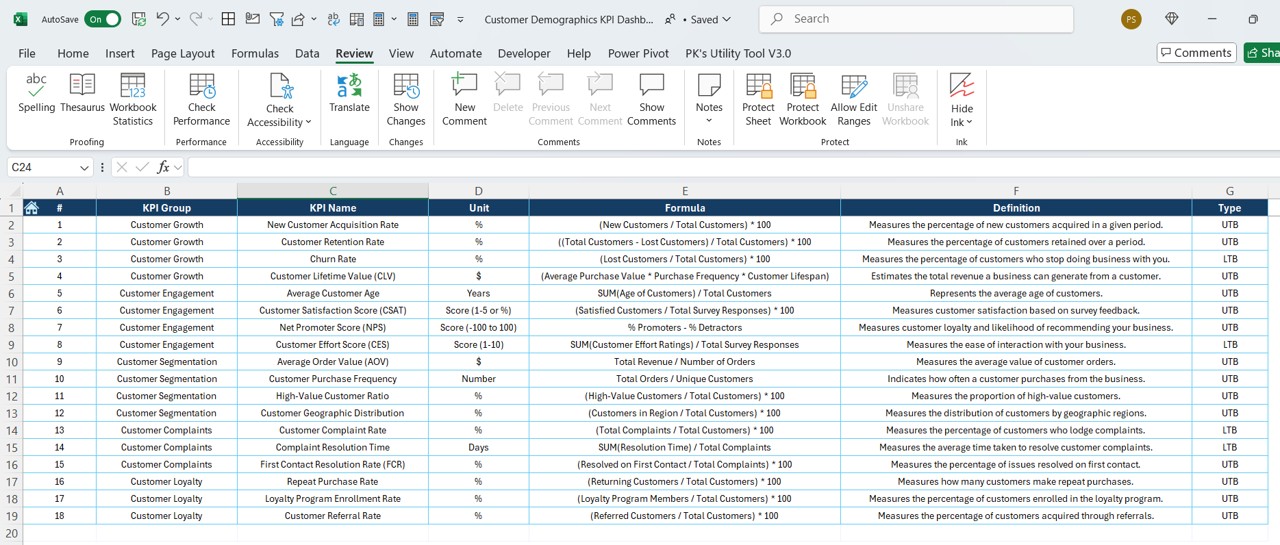
- This sheet contains:
- KPI Names
- KPI Groups
- Units
- Formulas
- Detailed KPI Definitions
Advantages of Using the Customer Demographics KPI Dashboard
- Data-Driven Decision Making: Helps businesses track demographic trends, customer preferences, and market changes.
- Automated Data Analysis: Eliminates manual calculations and updates automatically when new data is entered.
- Goal Tracking & Performance Monitoring: Provides a visual representation of actual vs. target performance, helping businesses adjust strategies accordingly.
- User-Friendly Interface: Simple drop-down selections and pre-set formatting make it easy to use, even for non-technical users.
- Dynamic KPI Trend Analysis: Displays historical trends for customer demographics, enabling businesses to identify patterns and make predictions.
Best Practices for Using the Customer Demographics KPI Dashboard
✅ Define Clear KPI Metrics
- Ensure the selected KPIs align with your business objectives.
- Example KPIs:
- Customer Growth Rate
- Customer Retention Rate
- Average Customer Age
- Gender Distribution
- Geographical Distribution
✅ Regular Data Updates
- Update actual data in the Actual Numbers Input sheet consistently.
- Keep the Previous Year Numbers sheet updated for meaningful comparisons.
✅ Set Realistic Targets
- Define achievable targets based on historical data trends and business goals.
✅ Utilize Conditional Formatting
- Use visual indicators like up/down arrows, color coding, and trend charts to make insights easy to understand.
✅ Ensure Data Accuracy
- Double-check data inputs to prevent reporting errors.
Frequently Asked Questions (FAQs)
What is a Customer Demographics KPI Dashboard?
A Customer Demographics KPI Dashboard is an Excel-based tool that helps businesses track and analyze key demographic data such as customer age, gender, location, and purchasing behavior.
How does the month selection feature work?
- The Dashboard sheet has a drop-down list (D3) where users can select a specific month.
- When a month is selected, the dashboard updates all MTD and YTD metrics accordingly.
Can I customize the KPIs in this dashboard?
Yes! The KPI Definition Sheet allows users to modify or add new KPIs, change their formulas, and categorize them as Lower is Better or Upper is Better.
Is this dashboard suitable for small businesses?
Absolutely! Whether you run a small business or a large corporation, this dashboard can help track customer demographic trends efficiently.
How often should I update the data?
It’s best to update the Actual Numbers Input Sheet regularly—either daily, weekly, or monthly—depending on how frequently customer demographic data changes in your business.
Click to Customer Demographics KPI
Conclusion
A Customer Demographics KPI Dashboard in Excel is an invaluable tool for businesses seeking data-driven insights into their customer base. With its automated tracking, visual reporting, and customizable features, it simplifies customer analytics and decision-making. By following best practices and keeping data updated, businesses can ensure accurate, real-time monitoring of customer trends, ultimately driving growth and improving marketing strategies.
Click to Customer Demographics KPI
Visit our YouTube channel to learn step-by-step video tutorials