Customer Lifetime Value (CLV) is a crucial metric for businesses aiming to maximize long-term revenue. Understanding the CLV helps businesses strategize marketing, sales, and customer retention efforts effectively. To simplify tracking and analyzing CLV, we have designed a Customer Lifetime Value KPI Dashboard in Excel. This ready-to-use template allows businesses to monitor essential KPIs with visual charts and dynamic data tracking.
In this article, we will explore the key features, advantages, and best practices for using this dashboard effectively. Additionally, we will address common questions to ensure you make the most of this powerful Excel tool.
Click to Customer Lifetime Value KPI
Why Use a Customer Lifetime Value KPI Dashboard?
- A well-structured CLV KPI Dashboard in Excel provides businesses with actionable insights by:
- Tracking key performance indicators (KPIs) to measure customer value over time.
- Comparing actual performance with target goals and previous year data.
- Visualizing trends to help make data-driven decisions.
- Improving customer retention strategies by identifying profitable customer segments.
Key Features of the Customer Lifetime Value KPI Dashboard
This dashboard consists of seven worksheets, each playing a unique role in organizing and analyzing CLV data.
Home Sheet
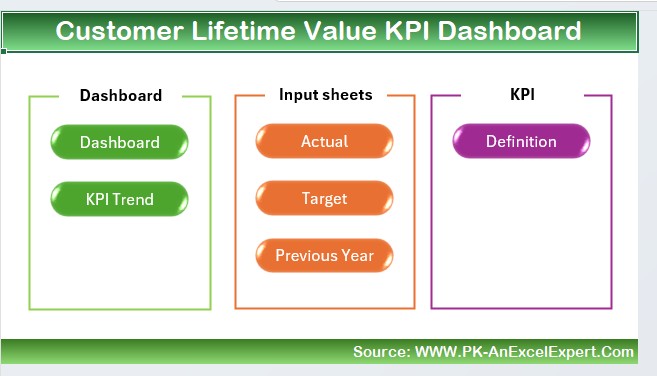
- The Home Sheet serves as an index page with six buttons that allow you to navigate to different sections of the dashboard quickly.
Dashboard Sheet Tab
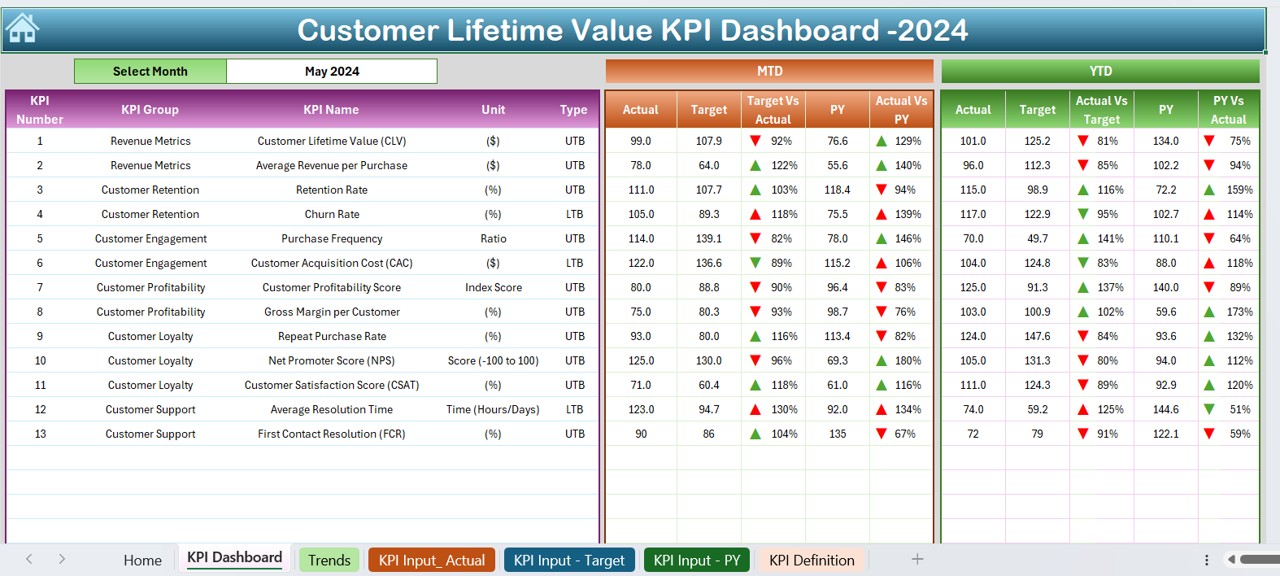
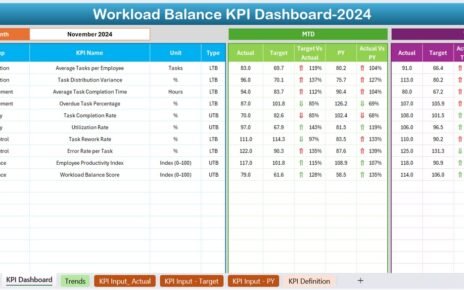
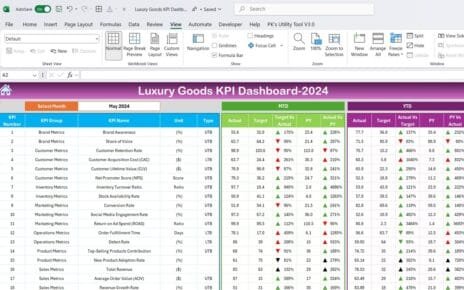
- This is the main dashboard view, providing a comprehensive summary of all KPIs.
- Dynamic month selection: Choose a specific month using a dropdown in D3 to update the dashboard.
- Real-time KPI updates: The dashboard reflects changes for Month-to-Date (MTD) and Year-to-Date (YTD) actual, target, and previous year values.
- Performance comparison: Includes Conditional Formatting with up/down arrows to indicate performance trends.
Click to Customer Lifetime Value KPI
KPI Trend Sheet Tab
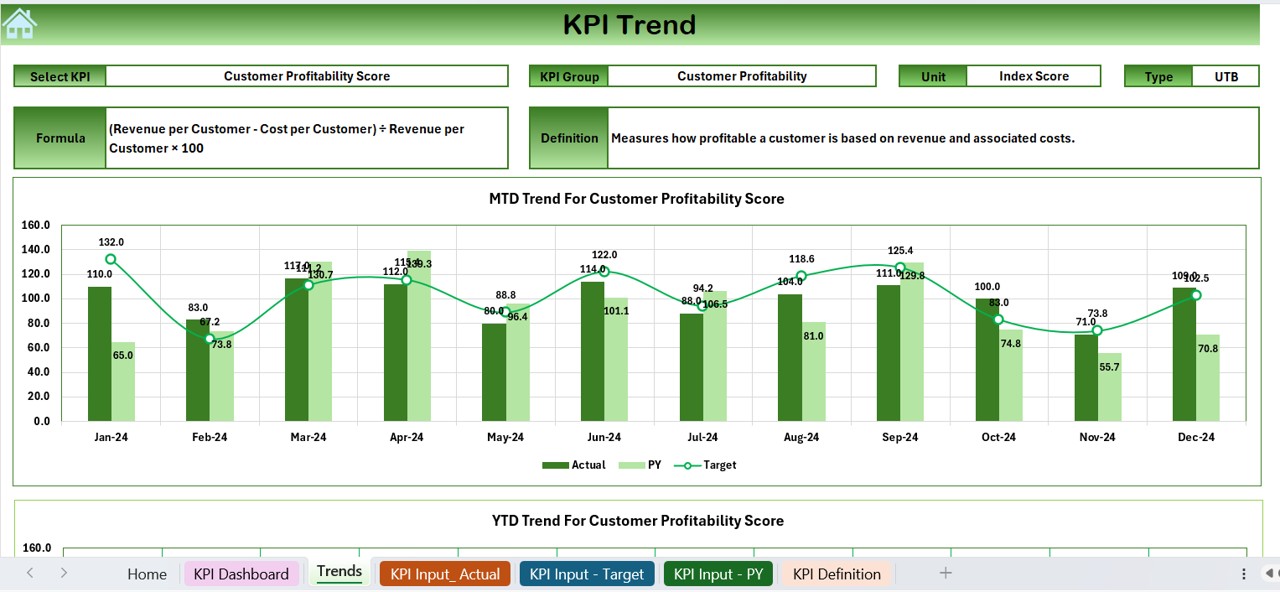
- Select the KPI name from the dropdown in C3.
- Displays KPI details including:
- KPI Group
- Unit of KPI
- KPI Type (Lower is better / Upper is better)
- KPI Formula
- KPI Definition
- Trend charts for MTD and YTD showing actual, target, and previous year values.
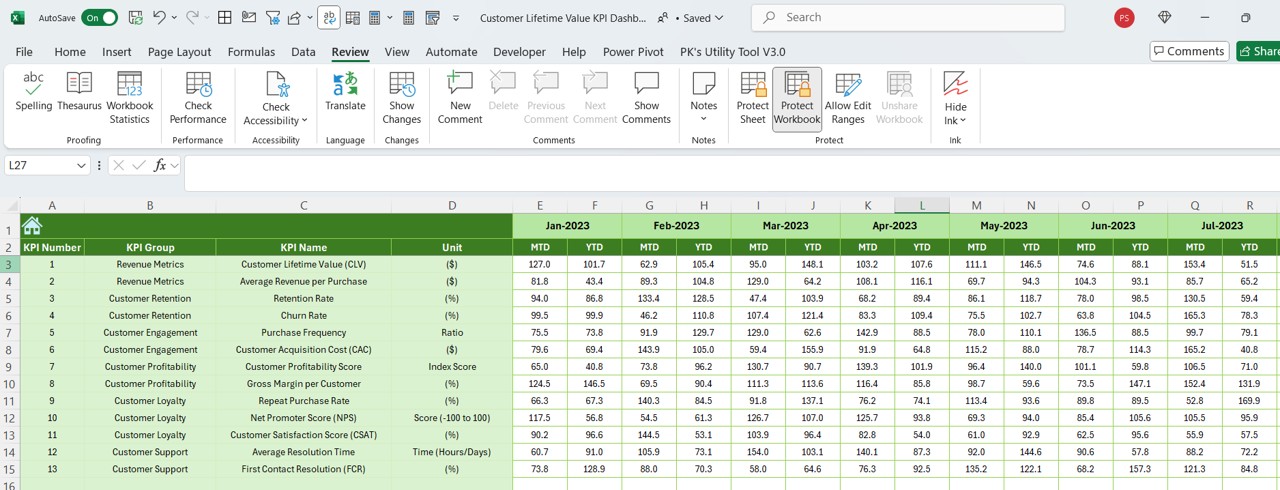
Actual Numbers Input Sheet
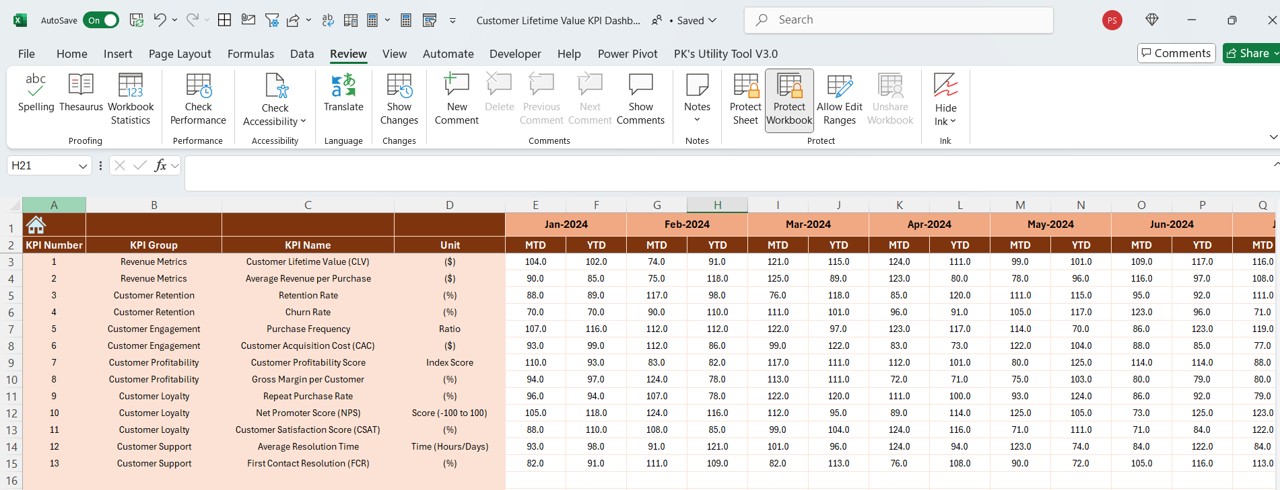
- Enter actual MTD and YTD numbers for each month.
- Change the starting month from E1.
Target Sheet Tab
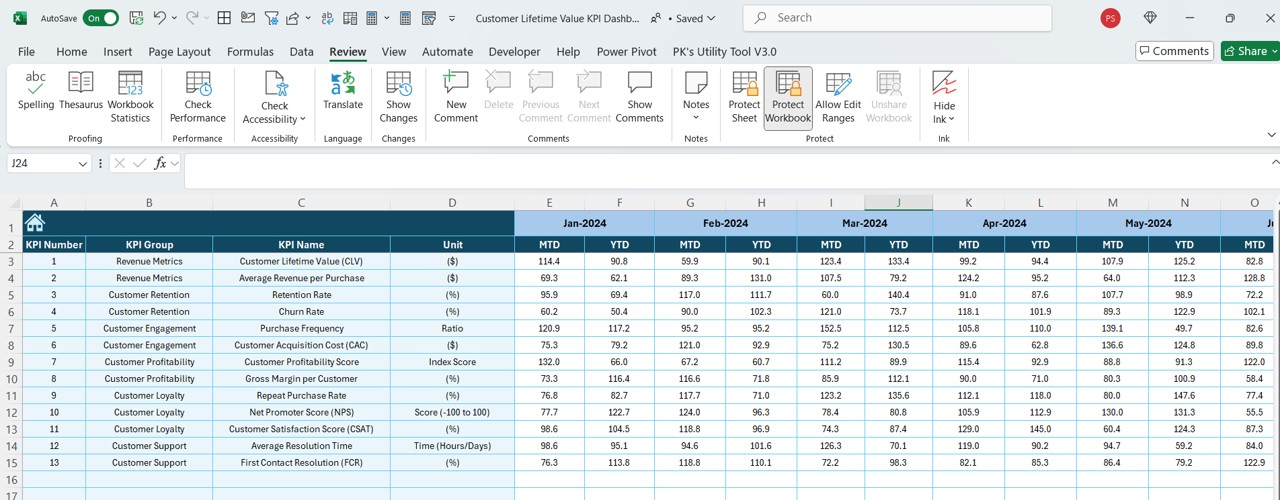
- Define monthly target values for each KPI (MTD & YTD).
Previous Year Number Sheet Tab
- Input previous year’s KPI values to compare trends.
Click to Customer Lifetime Value KPI
KPI Definition Sheet Tab
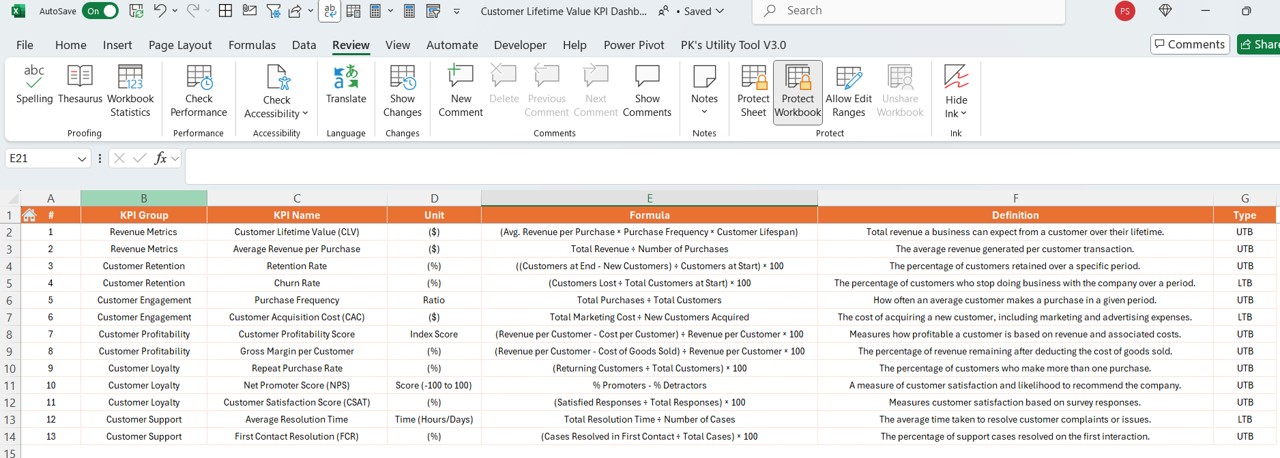
- Maintain a repository of KPIs with essential details like:
- KPI Name
- KPI Group
- Unit
- Formula
- Definition
Advantages of Using the Customer Lifetime Value KPI Dashboard
- Easy Data Input & Management – Predefined sheets streamline data entry for actual, target, and previous year numbers.
- Automated KPI Tracking – Dashboard updates dynamically based on month selection and data inputs.
- Performance Comparison at a Glance – Conditional formatting highlights KPIs that need attention.
- Interactive Trend Analysis – Graphs show MTD and YTD trends for strategic decision-making.
- Customizable & Scalable – Easily modify KPI definitions and formulas to fit business needs.
Best Practices for Using the Customer Lifetime Value KPI Dashboard
To maximize the benefits of this dashboard, follow these best practices:
Keep Data Updated
- Regularly input actual and target values to maintain accuracy.
- Ensure previous year data is correctly entered for meaningful comparisons.
Utilize Conditional Formatting
- Pay attention to up/down arrows to spot declining performance quickly.
- Identify KPIs that need immediate action based on color-coded trends.
Analyze Trends
- Use the KPI Trend Sheet to monitor long-term performance.
- Compare current vs. past performance to understand patterns.
Adjust Targets Based on Data
- If trends indicate underperformance, revise targets accordingly.
- Use real-time insights to set realistic KPI goals.
Customize for Business Needs
- Modify KPI definitions to align with business objectives.
- Add new KPIs as your business grows and evolves.
Click to Customer Lifetime Value KPI
Conclusion
The Customer Lifetime Value KPI Dashboard in Excel is an essential tool for tracking and optimizing customer value. By offering a structured and visual representation of KPIs, businesses can make data-driven decisions to enhance customer retention and revenue. Following best practices ensures maximum efficiency and usability.
Frequently Asked Questions (FAQs)
What is Customer Lifetime Value (CLV)?
Customer Lifetime Value (CLV) is the estimated revenue a business can earn from a customer throughout their relationship. It helps in strategic planning and investment decisions.
Why is tracking CLV important?
- Tracking CLV helps businesses:
- Optimize customer acquisition costs.
- Identify high-value customers.
- Improve retention and engagement strategies.
Can I customize this Excel template?
- Yes! The dashboard is fully customizable. You can:
- Modify KPI definitions.
- Add new KPIs.
- Adjust conditional formatting rules.
Click to Customer Lifetime Value KPI
How often should I update the dashboard?
It is recommended to update the actual numbers monthly and review trends weekly for proactive decision-making.
What Excel version is required for this dashboard?
This dashboard is compatible with Excel 2016 or later, including Microsoft 365 for best performance.
Click to Customer Lifetime Value KPI
Visit our YouTube channel to learn step-by-step video tutorials
View this post on Instagram