In today’s competitive business environment, tracking and improving customer satisfaction is essential for long-term success. One of the most effective ways to monitor and enhance customer satisfaction is through the use of a Customer Satisfaction Improvement KPI Dashboard. This powerful tool allows businesses to visualize and analyze key performance indicators (KPIs) that directly impact customer experience and satisfaction levels.
In this article, we will explore what a Customer Satisfaction Improvement KPI Dashboard is, its key features, and the KPIs that should be included. We will also discuss the best practices for using such a dashboard, how it can drive improvements in customer satisfaction, and the opportunities it provides for continuous enhancement.
What is a Customer Satisfaction Improvement KPI Dashboard?
A Customer Satisfaction Improvement KPI Dashboard is a visual representation of the metrics that track customer satisfaction levels and service quality. By monitoring these KPIs, businesses can identify areas of improvement and take actionable steps to enhance their customer experience.
In a well-structured KPI dashboard, businesses can display MTD (Month-to-Date), YTD (Year-to-Date), and previous year’s data. This allows for a comparative analysis of the actual customer satisfaction results versus the set targets and historical performance.
Why Should You Use a KPI Dashboard for Customer Satisfaction?
Using a KPI dashboard enables businesses to:
- Track performance: You can easily see how your business is performing against targets and past performance.
- Identify trends: Spot patterns in customer behavior and satisfaction over time.
- Make data-driven decisions: Use insights from the dashboard to take informed actions.
- Improve customer experience: By monitoring KPIs, you can address any customer satisfaction issues and improve service quality.
With these benefits in mind, let’s dive deeper into the key features and KPIs that should be included in a Customer Satisfaction Improvement KPI Dashboard.
Key Features of a Customer Satisfaction Improvement KPI Dashboard
A Customer Satisfaction Improvement KPI Dashboard typically consists of several key features that help businesses track, analyze, and improve customer satisfaction. Here’s a breakdown of the features included in this type of dashboard:
1. Home Sheet
The Home Sheet acts as an Index Sheet where users can navigate to other sections of the dashboard. It contains buttons that link to the different sheets, making the dashboard easy to navigate and user-friendly.

Click to buy Customer Satisfaction Improvement KPI Dashboard in Excel
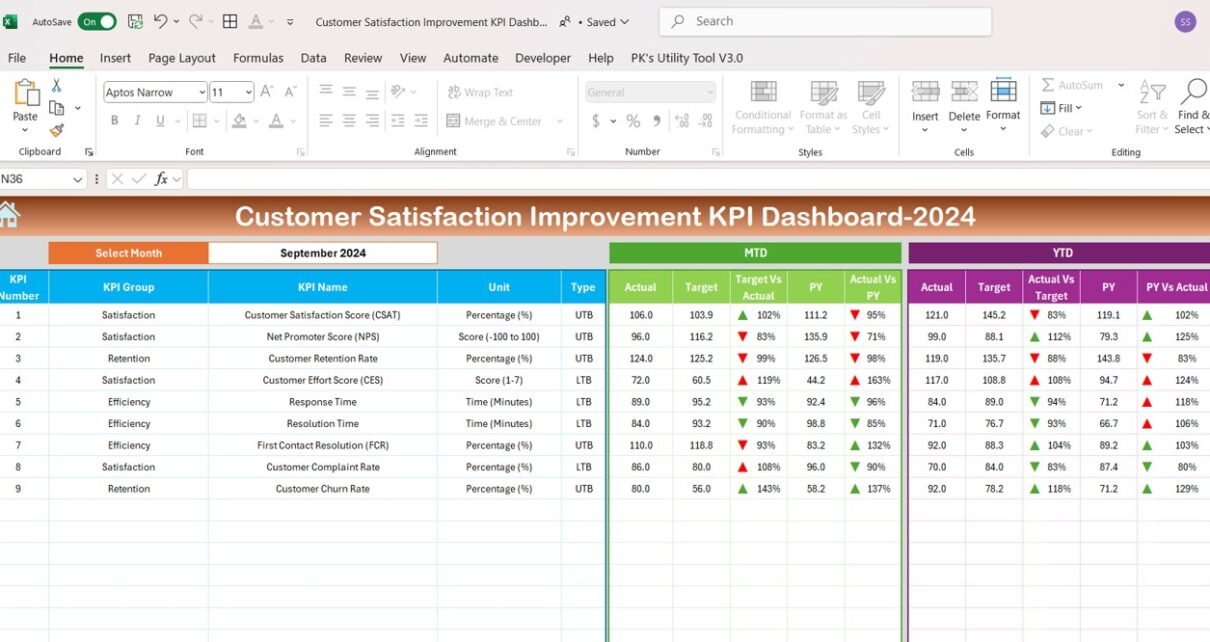
2. Dashboard Sheet Tab
This is the central part of the KPI Dashboard. Here, you can view all the KPIs with MTD, YTD, and previous year data. A dropdown menu allows users to select the month, and the dashboard automatically updates with the selected month’s data.

Click to buy Customer Satisfaction Improvement KPI Dashboard in Excel
In this section, you will find:
- MTD Actual vs. Target data.
- YTD Actual vs. Target data.
- Target vs Actual and Previous Year vs Actual comparisons with conditional formatting (e.g., up and down arrows).
3. KPI Trend Sheet Tab
The KPI Trend Sheet provides insights into the trends and performance of each KPI over time. In this sheet, users can select the KPI name from a dropdown, and it will show:
- KPI Group
- Unit of KPI
- Type of KPI (e.g., whether it is “Lower the better” or “Upper the better”)
- Formula for KPI calculation
- KPI Definition

Click to buy Customer Satisfaction Improvement KPI Dashboard in Excel
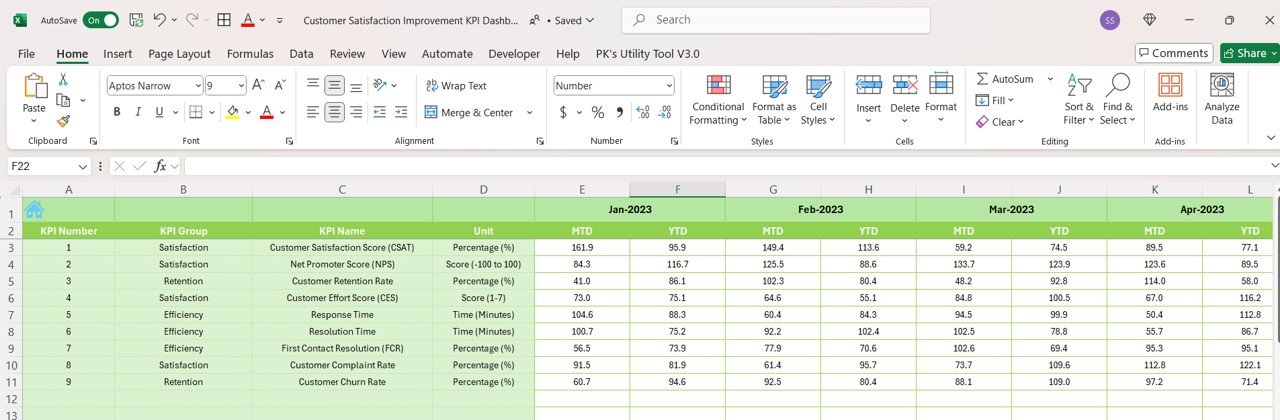
4. Actual Numbers Sheet Tab
This sheet allows users to enter the actual numbers for the YTD and MTD values for each KPI. The user can easily update the month by modifying a value in range E1.

Click to buy Customer Satisfaction Improvement KPI Dashboard in Excel
5. Target Sheet Tab
In this section, users enter the target numbers for each KPI for both MTD and YTD. It helps compare the performance of the business against set goals.

Click to buy Customer Satisfaction Improvement KPI Dashboard in Excel
6. Previous Year Numbers Sheet Tab
This sheet is used to input the previous year’s data for comparison with the current year’s performance. It allows for a side-by-side comparison to track improvements or regressions in customer satisfaction.
7. KPI Definition Sheet Tab
Click to buy Customer Satisfaction Improvement KPI Dashboard in Excel
In this section, businesses can input the following information for each KPI:
- KPI Name
- KPI Group
- Unit
- Formula
- KPI Definition
This provides clarity on the purpose and calculation of each KPI, helping users understand how each metric is derived.

Click to buy Customer Satisfaction Improvement KPI Dashboard in Excel
Advantages of Using a Customer Satisfaction Improvement KPI Dashboard
Implementing a Customer Satisfaction Improvement KPI Dashboard offers numerous advantages for businesses aiming to enhance customer experience. Below are some of the key benefits:
- Improved Decision-Making: By monitoring KPIs in real time, businesses can make informed, data-driven decisions to improve customer satisfaction. The dashboard provides quick access to key metrics, enabling managers to act swiftly.
- Enhanced Customer Experience: The dashboard allows businesses to identify trends, track progress, and pinpoint areas that need improvement. This enables companies to take targeted actions to enhance the customer experience.
- Goal Alignment: The dashboard aligns business activities with customer satisfaction goals. By setting and tracking KPIs, businesses can ensure that their efforts are focused on improving customer experience.
- Better Resource Allocation: When businesses identify which KPIs need the most attention, they can allocate resources more effectively. This helps in improving performance where it matters the most.
Opportunities for Improvement in Customer Satisfaction KPIs
While a Customer Satisfaction Improvement KPI Dashboard offers significant insights, there are always opportunities to improve the tracking and measurement of customer satisfaction. Some areas for improvement include:
- Integration with Other Systems: Integrating the KPI dashboard with other business systems, such as CRM or customer support tools, can provide even deeper insights into customer satisfaction.
- Automation of Data Entry: Automating the data entry process for MTD and YTD figures can reduce errors and save time.
- Real-Time Analytics: Incorporating real-time analytics can help businesses stay ahead of emerging customer satisfaction trends.
- More Advanced KPIs: Including more advanced KPIs, such as Customer Lifetime Value (CLV) or Customer Satisfaction Index (CSI), can offer more nuanced insights.
Best Practices for the Customer Satisfaction Improvement KPI Dashboard
To make the most of your Customer Satisfaction Improvement KPI Dashboard, here are some best practices:
- Set Clear Goals: Establish specific customer satisfaction goals for each KPI.
- Regular Updates: Ensure that the dashboard is updated regularly with current data for accurate analysis.
- Keep It Simple: The dashboard should be easy to navigate and not overly complex.
- Monitor KPIs Consistently: Track the KPIs consistently to spot trends and respond quickly to any emerging issues.
- Review and Revise KPIs: Regularly review the relevance of the KPIs and adjust them if needed.
Conclusion
A Customer Satisfaction Improvement KPI Dashboard is a valuable tool that can help businesses track and improve their customer satisfaction efforts. By monitoring key metrics and comparing them against set targets and historical data, companies can take proactive measures to enhance their customer experience. By incorporating best practices and continuously improving the dashboard, businesses can stay competitive in today’s fast-paced market.
Frequently Asked Questions (FAQs)
1. What is the most important KPI for customer satisfaction?
The Customer Satisfaction Score (CSAT) is one of the most important KPIs, as it directly measures how satisfied customers are with your service.
2. How often should I update the customer satisfaction dashboard?
It’s best to update the dashboard at least monthly to track trends and address any issues promptly.
3. Can I customize the KPIs in the dashboard?
Yes, you can customize the KPIs to suit your business’s specific needs and objectives.
4. How do I use the Customer Satisfaction Improvement KPI Dashboard?
Simply input your MTD, YTD, and previous year data into the respective sheets and select the month to view real-time data.
Visit our YouTube channel to learn step-by-step video tutorials
View this post on Instagram
Click to buy Customer Satisfaction Improvement KPI Dashboard in Excel


