Managing customer service performance effectively is crucial for any business striving to improve customer satisfaction and overall efficiency. A Customer Service KPI Dashboard in Power BI is an excellent tool for tracking and analyzing key metrics. By using this dashboard, you can monitor your team’s performance, identify gaps, and make data-driven decisions with ease Customer Service KPI Dashboard.
Click to Customer Service KPI
In this article, we’ll walk you through everything you need to know about this dashboard, including its structure, key features, best practices, and answers to common questions. Let’s dive in!
What is a Customer Service KPI Dashboard?
A Customer Service KPI Dashboard is a visual tool designed to track and display important metrics (KPIs) related to customer service. With Power BI, you can create an interactive dashboard that provides real-time insights into your team’s performance.
This dashboard relies on an Excel file as its data source, making it easy to update and manage. Whether you’re a beginner or an experienced Power BI user, you’ll find this dashboard both accessible and highly effective.
Click to Customer Service KPI
Key Features of the Customer Service KPI Dashboard
The dashboard includes three pages in the Power BI file, each offering unique insights and tools to track performance.
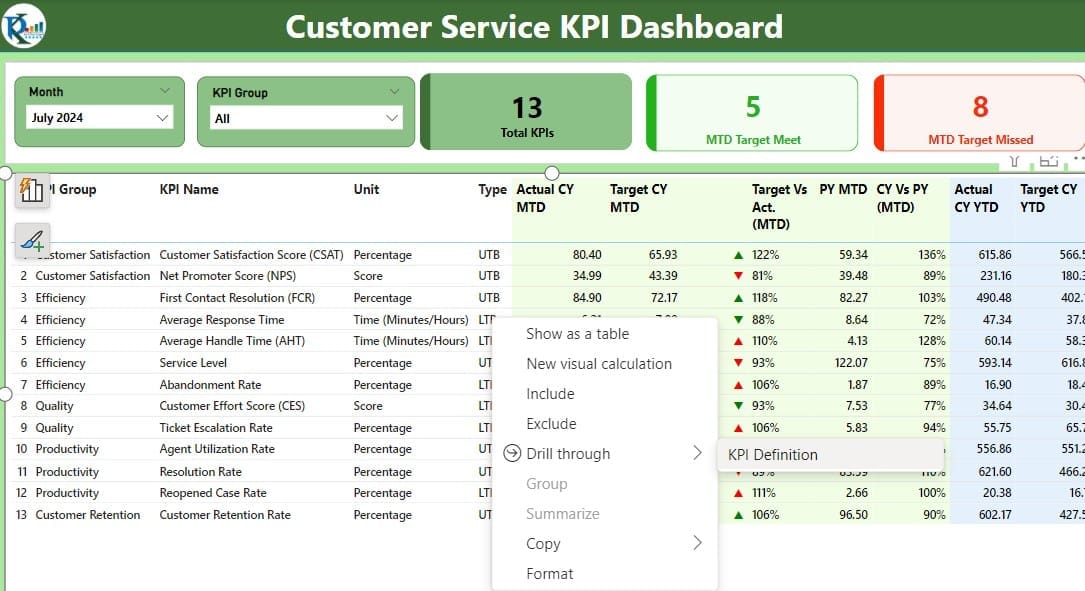
Summary Page
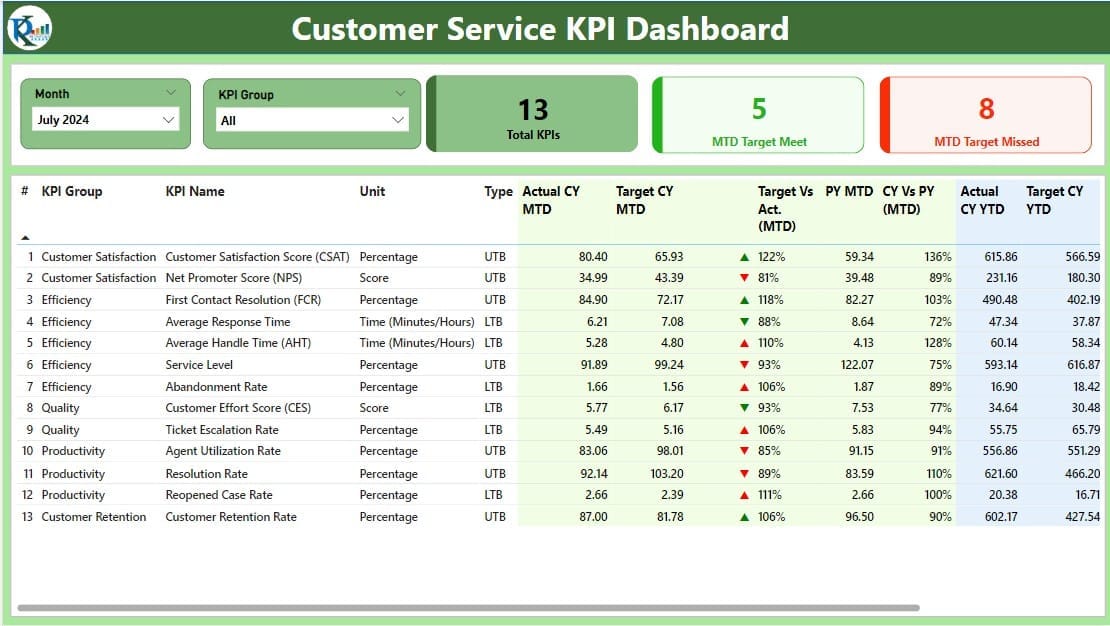
The Summary Page is the main page of the dashboard. It provides a quick overview of all the key metrics.
- Features of the Summary Page:
- Slicers for Filtering: You can filter the data by Month and KPI Group to focus on specific periods or categories.
- Performance Cards:
- Total KPIs Count: Displays the total number of KPIs being tracked.
- MTD Target Met: Shows how many KPIs have met the monthly target.
- MTD Target Missed: Highlights the KPIs that are falling short of the monthly target.
- Detailed KPI Table:
- Lists KPI details like KPI Number, Group, and Name.
- Includes data on Current Year (CY) and Previous Year (PY) metrics for MTD and YTD.
- Uses red (▼) and green (▲) icons to indicate whether KPIs are on track.
- Provides Target vs. Actual percentages for quick comparisons.
- The Summary Page gives a comprehensive snapshot of how your customer service team is performing at any given time.
Click to Customer Service KPI
KPI Trend Page
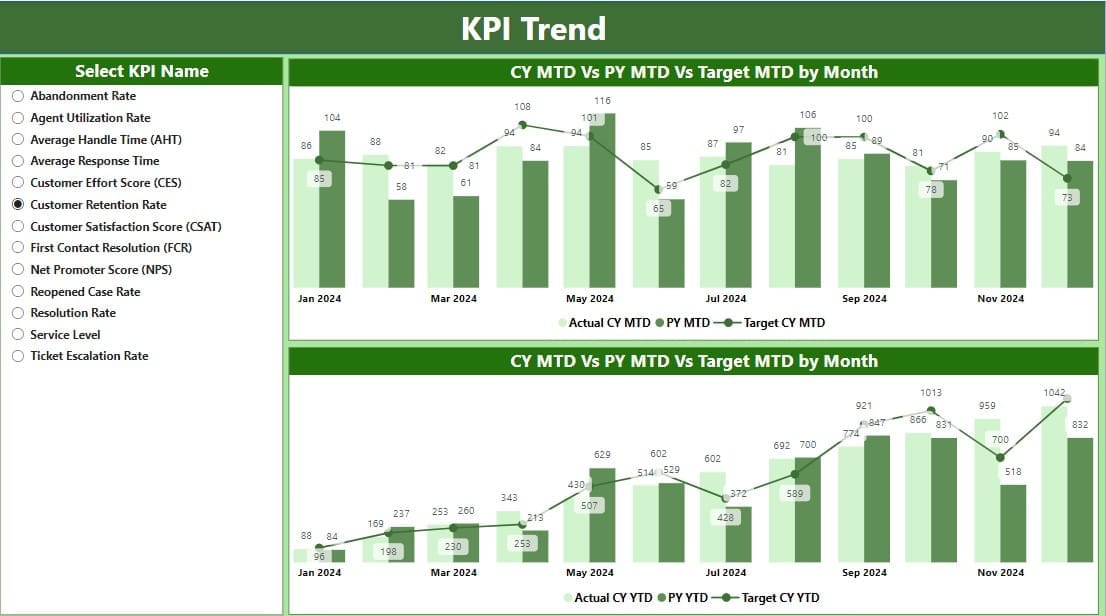
This page is all about visualizing trends for specific KPIs over time. It allows you to understand how metrics are evolving and compare performance across different time frames.
- Features of the KPI Trend Page:
- Interactive Combo Charts:
- One chart displays MTD values for Actual, Target, and Previous Year.
- The second chart focuses on YTD values.
- KPI Slicer: You can select specific KPIs to analyze their trends over months or years.
By observing trends, you can quickly identify which areas are improving and which need more attention.
Click to Customer Service KPI
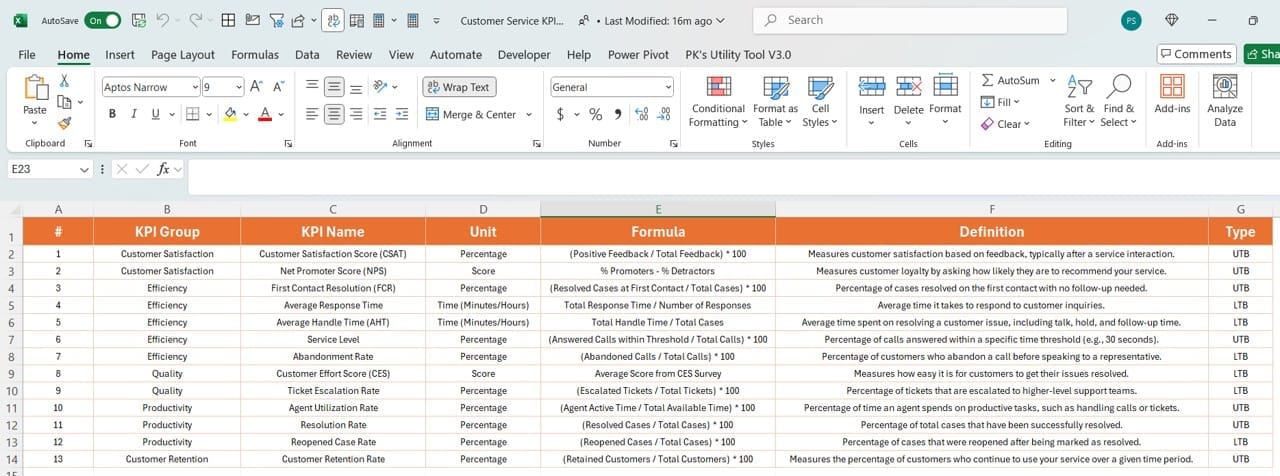
KPI Definition Page
This hidden drill-through page provides in-depth details about each KPI, such as its formula and definition.
Features of the KPI Definition Page:
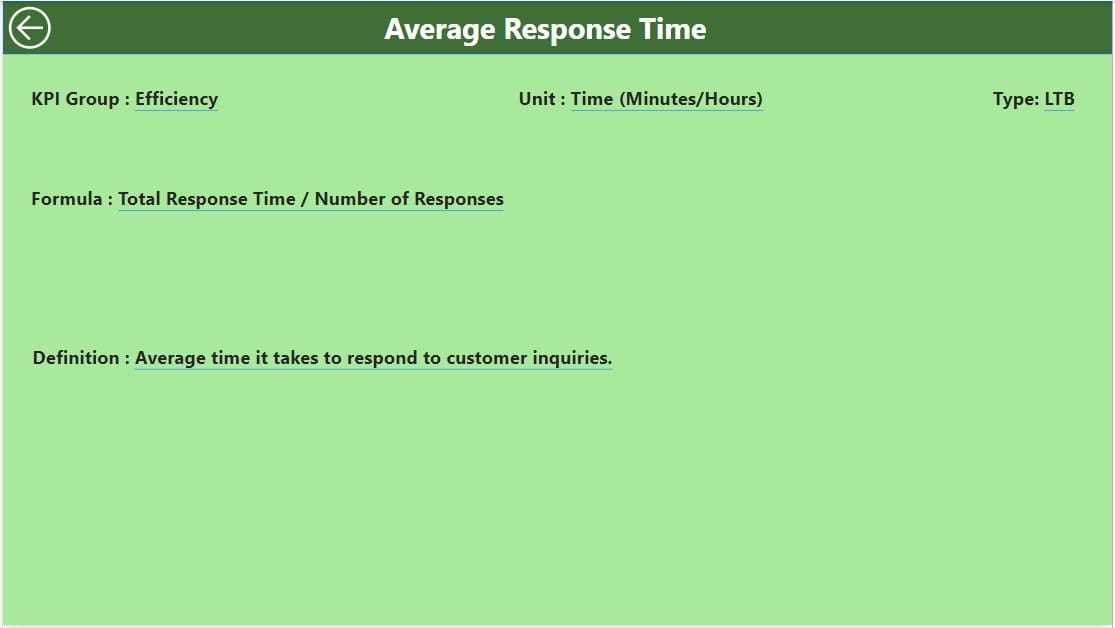
Comprehensive KPI Details:
Includes information like the formula used, the unit of measurement, and the type of KPI (Lower the Better or Upper the Better).
- Back Button Navigation: Easily return to the Summary Page by clicking the back button in the top-left corner.
This page helps users understand the calculations behind each KPI, ensuring clarity and transparency.
Click to Customer Service KPI
Using Excel as the Data Source
The dashboard integrates with an Excel file, making it easy to update and manage data. The file includes three key worksheets for input and organization.
Input Actual Sheet
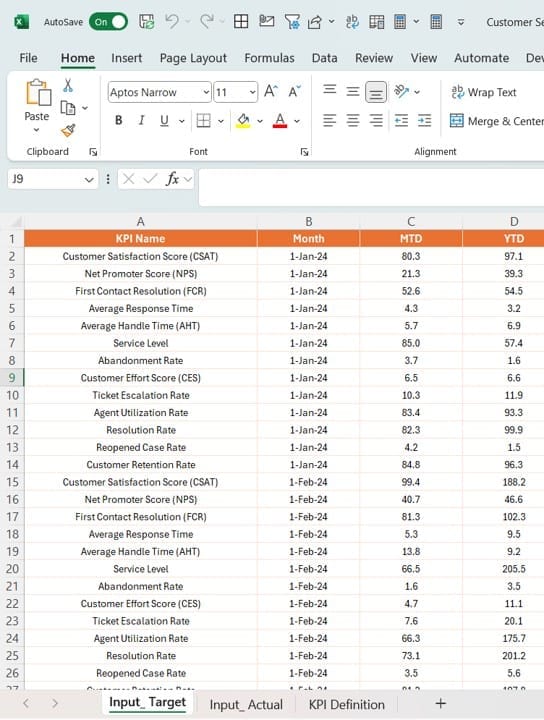
Here, you enter the actual numbers for:
- KPI Name.
- Month (use the first day of the month).
- MTD and YTD values.
Click to Customer Service KPI
Input Target Sheet
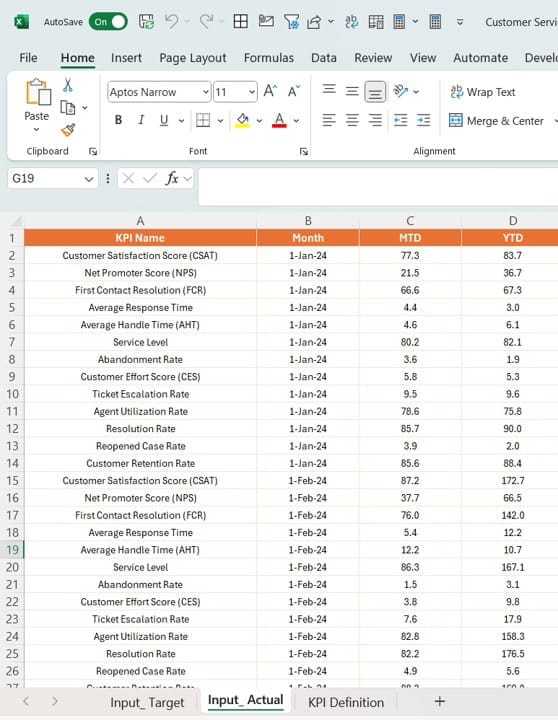
This sheet is for target numbers. Fill in:
- KPI Name.
- Month (use the first day of the month).
- MTD and YTD values.
KPI Definition Sheet
- Define each KPI by adding:
- KPI Number, Group, and Name.
- Unit, Formula, and Definition.
- Type (Lower the Better or Upper the Better).
- This structured approach ensures that the data powering the dashboard is accurate and consistent.
Advantages of Using the Customer Service KPI Dashboard
- Real-Time Monitoring: With the dashboard, you can track performance metrics in real-time. This allows you to respond to issues promptly and keep your team on track.
- Easy Customization: The dashboard is highly customizable. You can add or remove KPIs, modify visuals, or adjust slicers to fit your specific needs.
- Visual Clarity: Charts, icons, and tables provide a clear and intuitive way to understand your team’s performance at a glance.
- Performance Comparisons: You can compare current performance against previous periods to identify trends and measure improvement.
- Seamless Data Integration: The integration with Excel makes it easy to manage and update data without complex processes.
Click to Customer Service KPI
Best Practices for Using the Dashboard
- Regularly Update Data: Make it a habit to update the Excel file with the latest metrics. This ensures the dashboard reflects the most accurate information.
- Focus on Critical KPIs: Prioritize the KPIs that align with your business objectives. Use slicers to narrow down the data and concentrate on what matters most.
- Train Your Team: Ensure that everyone using the dashboard understands how to navigate it and interpret the data.
- Use Trends for Decision-Making: Leverage the KPI Trend Page to identify patterns and predict future performance.
- Verify Data Accuracy: Double-check the data in the Excel sheets to avoid discrepancies or errors in the dashboard.
Conclusion
The Customer Service KPI Dashboard in Power BI is an invaluable tool for any organization aiming to improve its customer service performance. With its user-friendly interface, real-time insights, and seamless Excel integration, this dashboard makes tracking and managing KPIs simple and effective.
By following best practices and regularly updating your data, you can unlock the full potential of this dashboard to enhance your decision-making and drive better results.
Frequently Asked Questions (FAQs)
Q. What is the main purpose of the Customer Service KPI Dashboard?
The dashboard tracks and analyzes customer service KPIs to ensure your team meets its targets and identifies areas for improvement.
Q. How do I update the data in the dashboard?
Simply update the Excel file used as the data source. Enter the latest data in the Input Actual, Input Target, and KPI Definition sheets.
Q. Can I customize the dashboard?
Yes, you can customize it by adding new KPIs, changing visuals, or modifying filters and slicers to suit your requirements.
Q. What tools are needed to use this dashboard?
You’ll need Microsoft Power BI Desktop and Microsoft Excel.
Q. How do I interpret the red and green icons?
- Green ▲: The KPI is meeting or exceeding its target.
- Red ▼: The KPI is falling short of its target.
Click to Customer Service KPI
Visit our YouTube channel to learn step-by-step video tutorials
View this post on Instagram