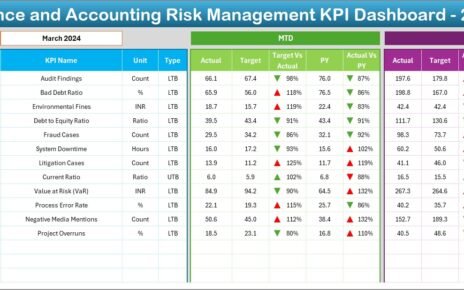
Risk management plays a critical role in finance and accounting. Without robust tracking tools, it becomes extremely difficult to identify
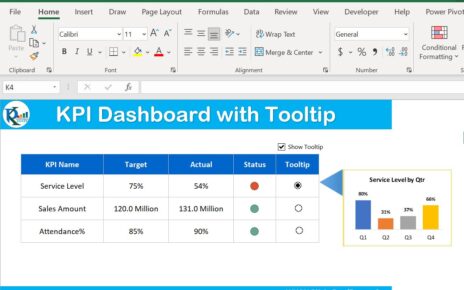
In this article, we have created Chart Tooltip in KPI Dashboard in Microsoft Excel. You can use this trick to
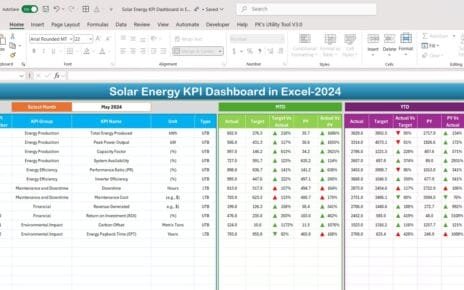
With the increasing demand for clean and sustainable energy, monitoring the performance of solar energy systems is more important than