Home>Download>3D Container Pivot Chart with Slicer and Timeline
3D Container Chart

3D Container Pivot Chart with Slicer and Timeline

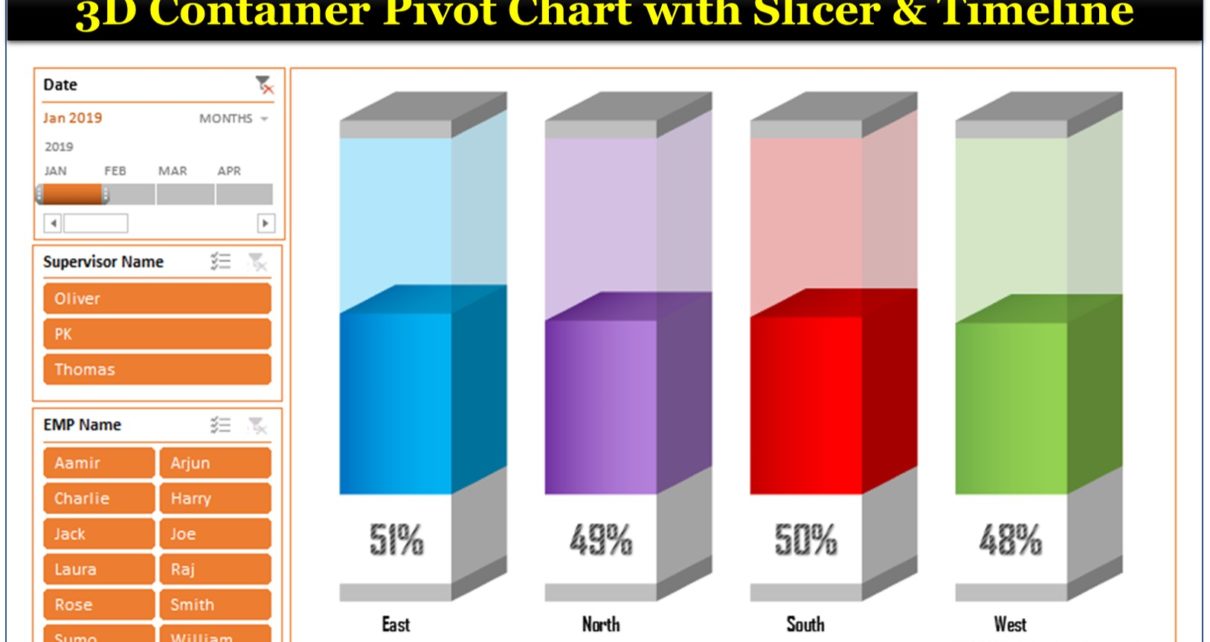
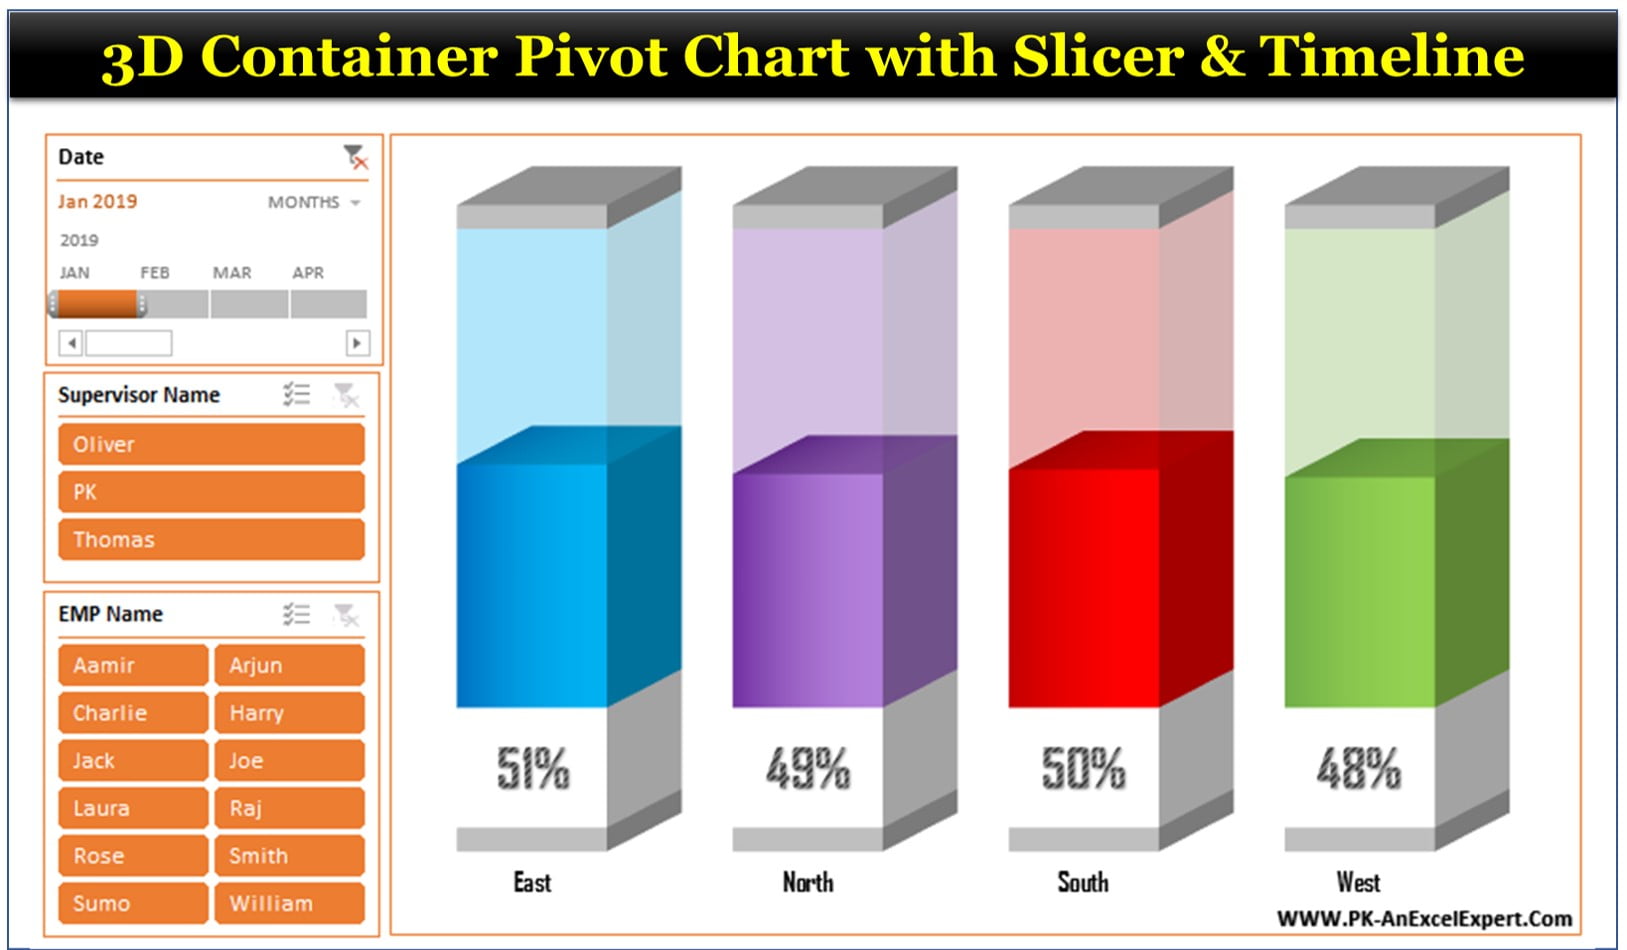
Elevate your data analysis with our cutting-edge 3D Container Pivot Chart with Slicer and Timeline in Excel. This advanced charting tool is designed to provide a dynamic visual representation of sales conversions by zone, using a combination of sophisticated pivot table functionalities and 3D graphical elements. It’s perfect for analysts and business professionals looking to deepen their insights and present data compellingly.

3D Container Pivot Chart with Slicer and Timeline

Key Features:

  • Advanced Data Segmentation: Utilizes slicers and a date timeline for easy filtering and examination of data across different parameters, enhancing user interaction and accessibility.
  • 3D Visualization: Offers a stunning 3D container view that elevates the presentation and understanding of complex data sets.
  • Customizable Pivot Table: Includes multiple calculated fields within the pivot table, allowing for tailored data analysis and metric tracking.
PK
Meet PK, the founder of PK-AnExcelExpert.com! With over 15 years of experience in Data Visualization, Excel Automation, and dashboard creation. PK is a Microsoft Certified Professional who has a passion for all things in Excel. PK loves to explore new and innovative ways to use Excel and is always eager to share his knowledge with others. With an eye for detail and a commitment to excellence, PK has become a go-to expert in the world of Excel. Whether you're looking to create stunning visualizations or streamline your workflow with automation, PK has the skills and expertise to help you succeed. Join the many satisfied clients who have benefited from PK's services and see how he can take your Excel skills to the next level!
https://www.pk-anexcelexpert.com