Home>Download>3D Glass Chart in Excel
3D Glass Chart

3D Glass Chart in Excel

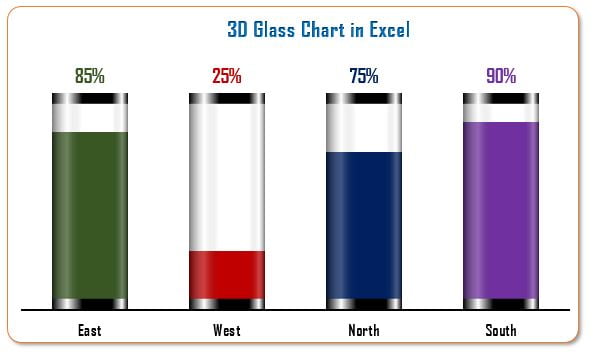
This is an unique and innovative 3D Glass Chart in Excel. This chart is perfect for displaying key performance indicators (KPIs) such as Service Level, Quality Score, and Productivity. In this guide, we will create a 3D Glass Chart to represent Zone Wise Service Level.


3D Glass Chart
3D-Glass-Chart-2.jpg


Key Features

  • Visually Striking Design: The 3D Glass Chart offers a modern and captivating way to present your data, making your KPIs stand out
  • Customizable Components: Learn how to create and adjust support columns, gradient fills, and transparency levels to achieve the perfect look for your chart.
  • Ready to use Template: This is a ready to use template. Just plugin your data and your chart will be ready.
PK
Meet PK, the founder of PK-AnExcelExpert.com! With over 15 years of experience in Data Visualization, Excel Automation, and dashboard creation. PK is a Microsoft Certified Professional who has a passion for all things in Excel. PK loves to explore new and innovative ways to use Excel and is always eager to share his knowledge with others. With an eye for detail and a commitment to excellence, PK has become a go-to expert in the world of Excel. Whether you're looking to create stunning visualizations or streamline your workflow with automation, PK has the skills and expertise to help you succeed. Join the many satisfied clients who have benefited from PK's services and see how he can take your Excel skills to the next level!
https://www.pk-anexcelexpert.com