Optimize your A/B testing process with our A/B Testing KPI Dashboard in Excel! This ready-to-use template helps you track, compare, and visualize key performance indicators (KPIs) for your A/B tests effortlessly. Whether you’re testing different marketing strategies, product features, or user experiences, this dashboard provides a structured approach to data-driven decision-making.
Key Features of the A/B Testing KPI Dashboard
Home Sheet
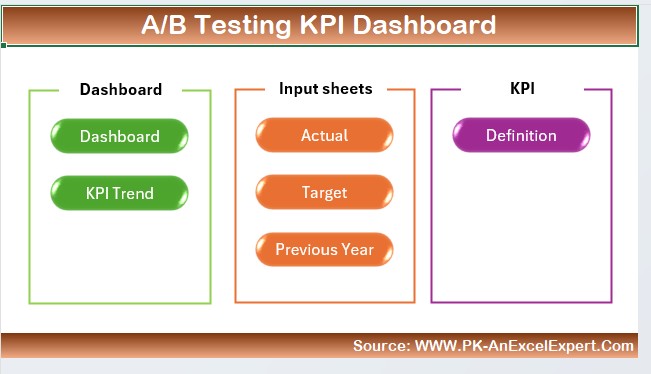
- A centralized navigation hub with quick-access buttons to different dashboard sections.
Dashboard Sheet
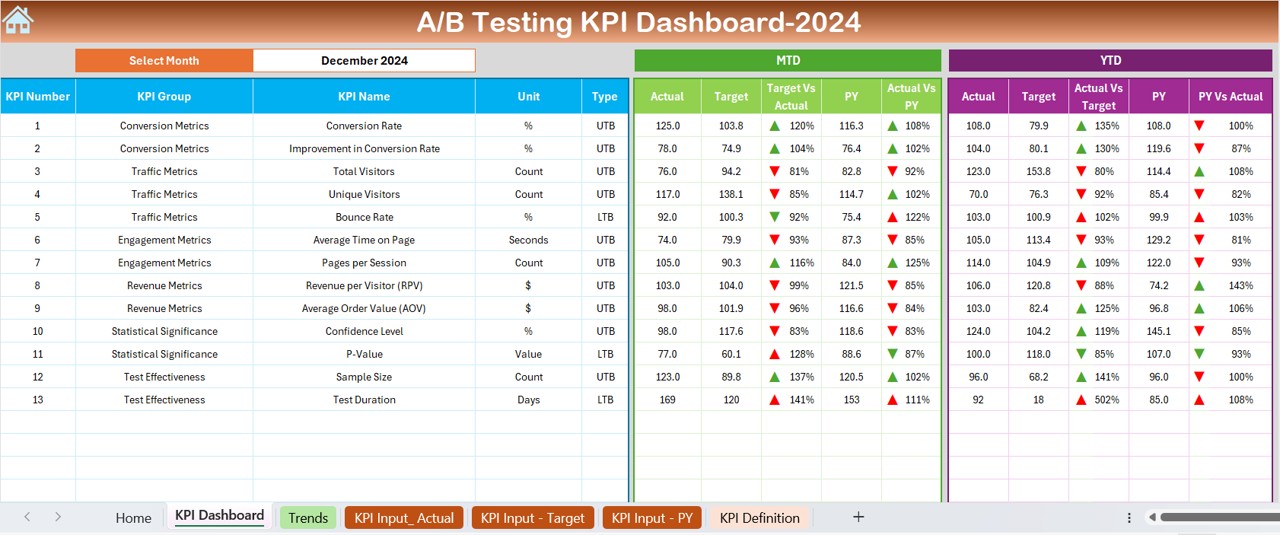
- A comprehensive performance overview, featuring MTD & YTD actual vs. target comparisons, along with conditional formatting for instant insights.
KPI Trend Sheet
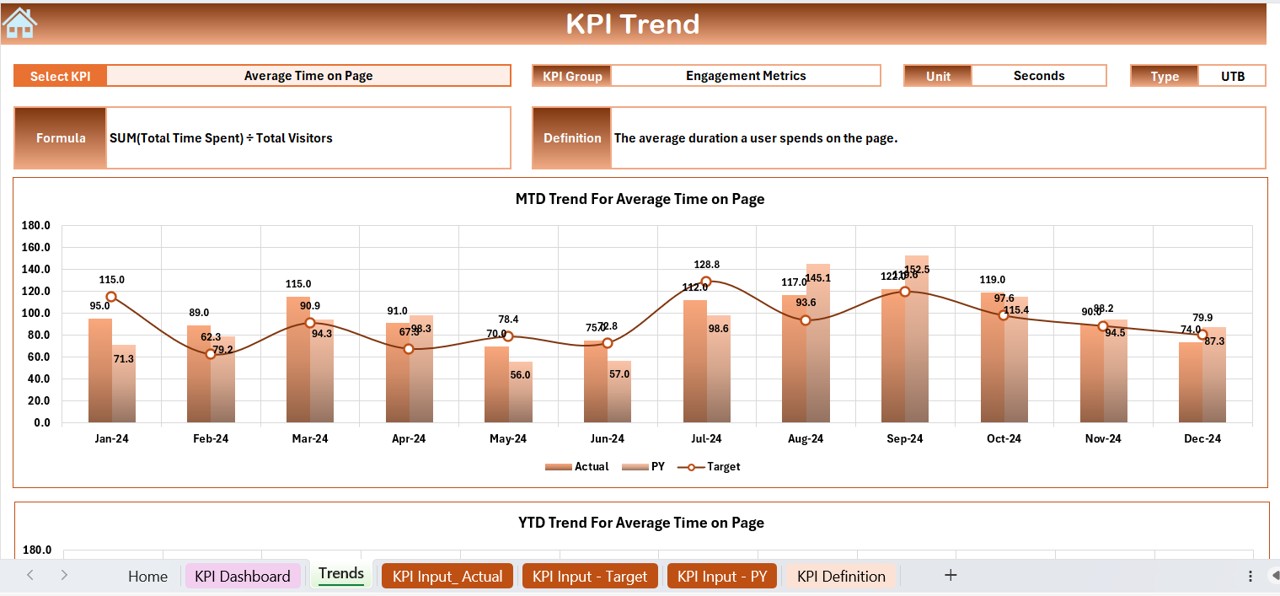
- Track KPI performance with MTD & YTD trend charts, drop-down selections, and details like KPI type, formula, and definition.
Actual Numbers Input Sheet
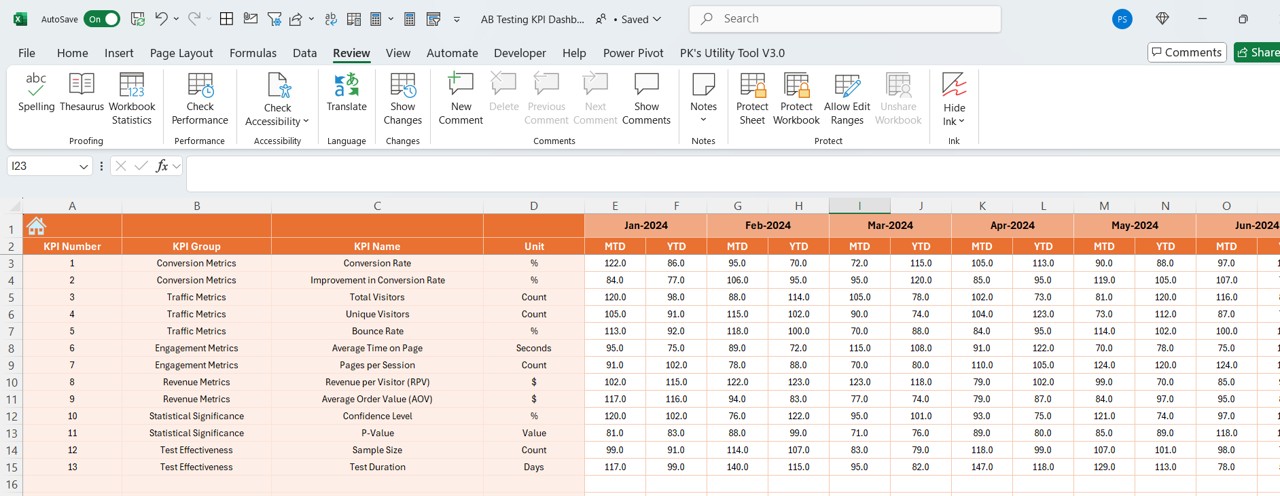
- Input your monthly and yearly actual performance to ensure real-time accuracy.
Target & Previous Year Sheets
- Enter KPI targets and historical data to compare results effectively.
KPI Definition Sheet
- Maintain a structured KPI database, including formulas, measurement units, and performance criteria.