Home>Download>A Stunning Chart to display the 5 KPI Metrics together
A Stunning Chart in Excel

A Stunning Chart to display the 5 KPI Metrics together

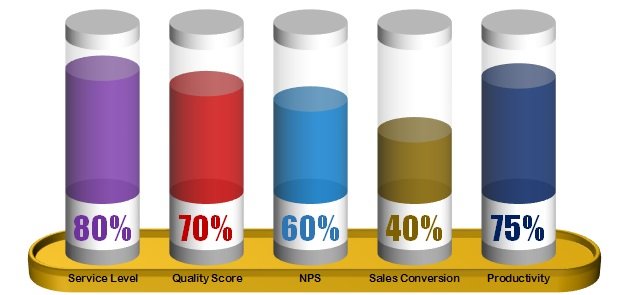
Introducing the “A Stunning Chart to display the 5 KPI Metrics together” Excel template. This expertly designed chart allows you to showcase up to five key performance indicators (KPIs) in a single, visually compelling format. Ideal for enhancing the clarity and impact of your reports, dashboards, or presentations.
A Stunning Chart to display the 5 KPI Metrics together

Key Features

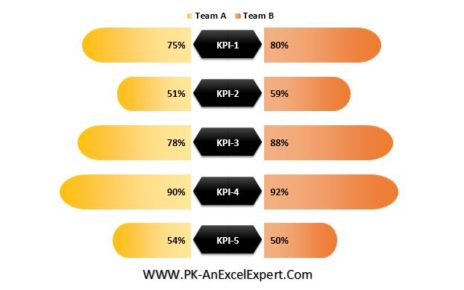
  • Customizable KPI Selection: Easily adapt the chart to include any metrics you need, from Service Level and Quality Score to Sales Conversion and Productivity.
  • Enhanced Visual Appeal: Make your data presentations more engaging with a beautifully crafted chart that highlights important performance metrics at a glance.
  • Versatile Application: Whether for business reports, analytic dashboards, or high-stakes presentations, this chart is designed to suit a variety of professional contexts.


PK
Meet PK, the founder of PK-AnExcelExpert.com! With over 15 years of experience in Data Visualization, Excel Automation, and dashboard creation. PK is a Microsoft Certified Professional who has a passion for all things in Excel. PK loves to explore new and innovative ways to use Excel and is always eager to share his knowledge with others. With an eye for detail and a commitment to excellence, PK has become a go-to expert in the world of Excel. Whether you're looking to create stunning visualizations or streamline your workflow with automation, PK has the skills and expertise to help you succeed. Join the many satisfied clients who have benefited from PK's services and see how he can take your Excel skills to the next level!
https://www.pk-anexcelexpert.com