Take control of your account management performance with our Account Management KPI Dashboard in Excel. This fully automated, user-friendly template allows businesses to track key KPIs, monitor trends, and analyze performance seamlessly. Designed for efficiency and accuracy, this dashboard ensures data-driven decision-making with just a few clicks.
Key Features of the Account Management KPI Dashboard:
Home Sheet
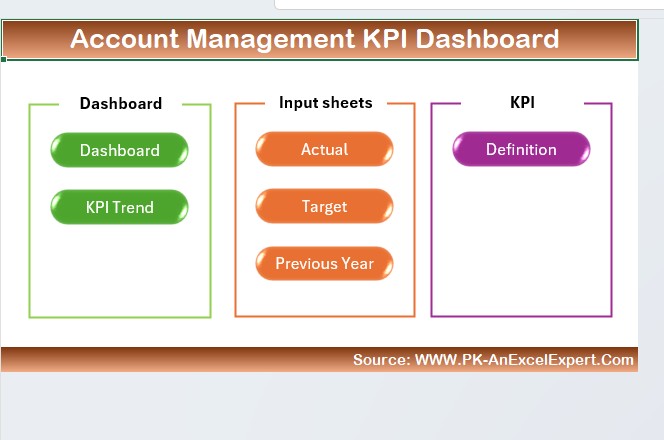
Acts as a navigation panel with quick-access buttons to different sections.
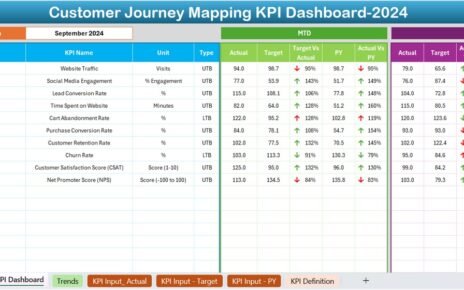
Dashboard Sheet
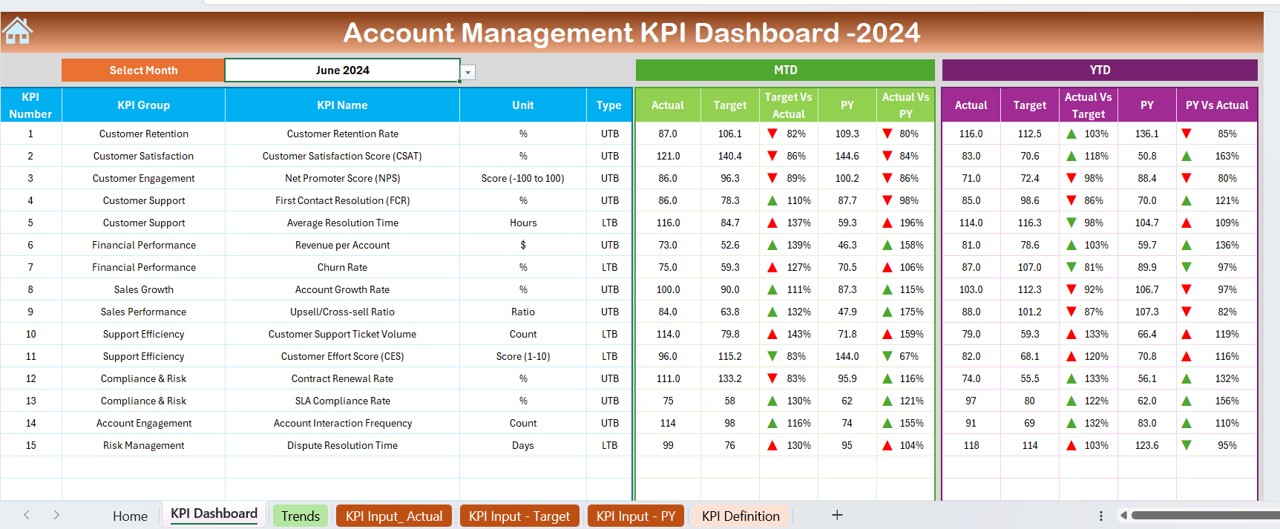
Displays MTD & YTD data, including Actual vs Target vs Previous Year (PY) comparisons with visual up/down indicators.
KPI Trend Analysis
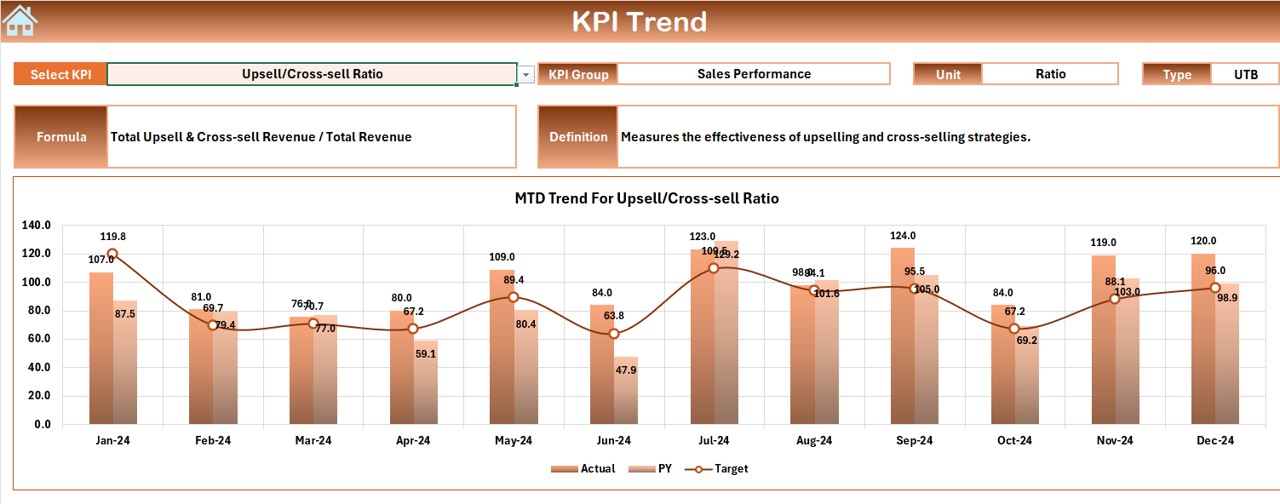
View KPI trends with dynamic charts and detailed KPI group, unit, formula, and definition.
Actual Numbers Input
Easily enter real-time MTD & YTD figures, with a month selector to update data efficiently.
Target & Previous Year Data
Record monthly target values and compare them with previous year data for strategic insights.
KPI Definition Sheet
Define and categorize each KPI with essential attributes for better understanding.