Managing accounts payable efficiently is essential for maintaining healthy cash flow and supplier relationships. Our Accounts Payable KPI Dashboard in Excel is a ready-to-use, dynamic template that helps businesses track key financial metrics, analyze trends, and improve decision-making. With interactive dashboards and real-time data visualization, this tool simplifies budget adherence and payment monitoring effortlessly.
Key Features of the Accounts Payable KPI Dashboard
7 Interactive Worksheets:
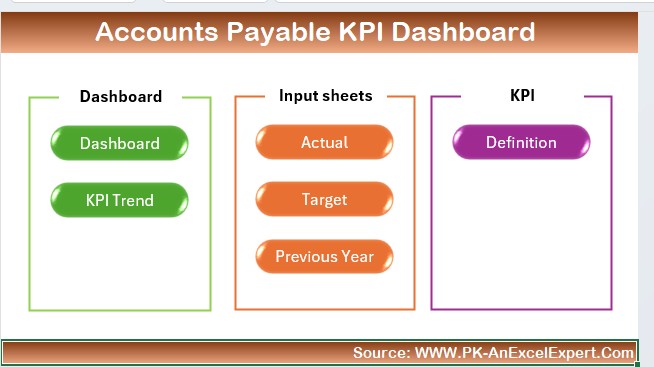
Well-structured sheets for seamless navigation and data management.
Comprehensive Dashboard View:
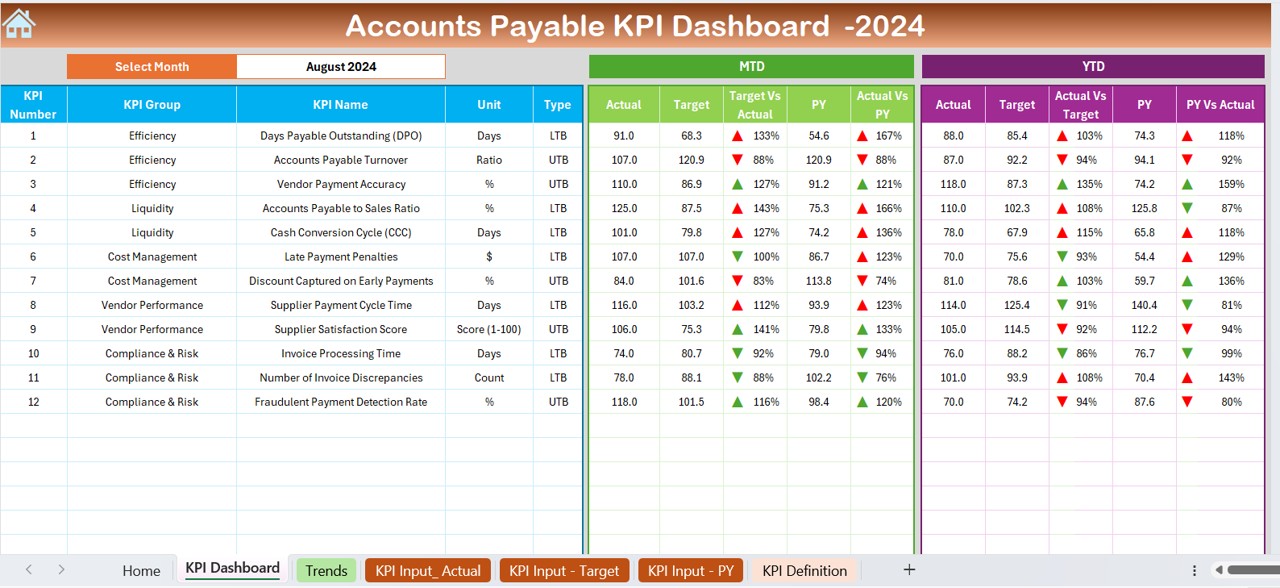
Displays MTD (Month-to-Date) and YTD (Year-to-Date) KPIs with actual, target, and previous year comparisons using conditional formatting.
Dynamic KPI Trend Analysis:
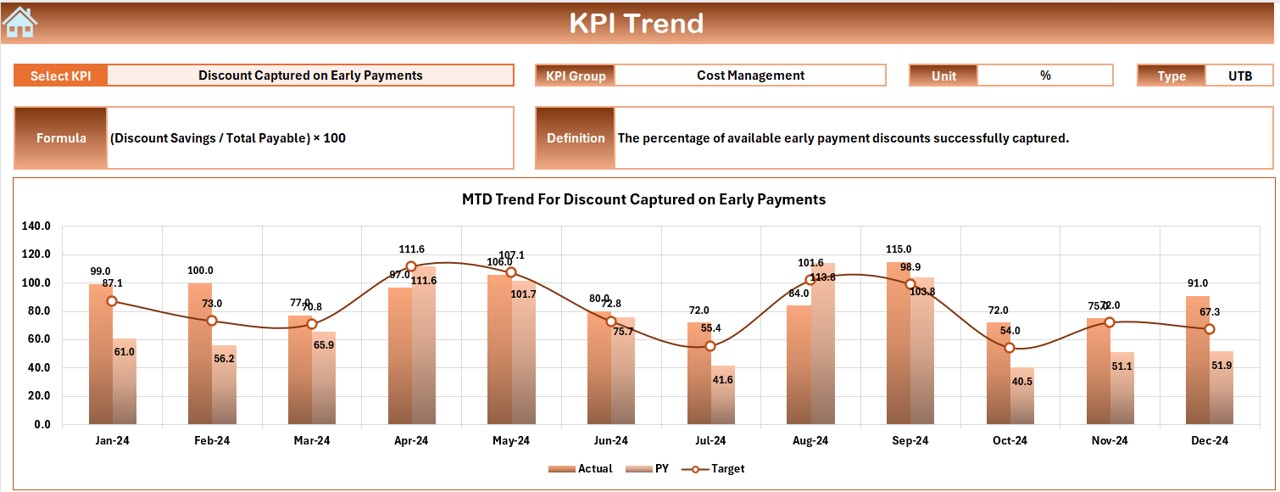
Choose KPIs from a drop-down list and view trends with MTD & YTD comparison charts.
User-Friendly Data Input Sheets:
Easily enter actual, target, and previous year numbers for precise financial tracking.
Automated Performance Indicators:
Up/down arrows highlight deviations between actuals vs. targets and past year trends.
KPI Definition Repository:
Clearly define KPI name, unit, formula, type (lower/upper better), and group for consistency.
Excel-Based Solution:
No complex software required—100% built in Excel with formulas and interactive elements.