In the fast-paced world of Agile project management, tracking key performance indicators (KPIs) is essential for ensuring that teams are on track to meet their sprint goals. The Agile Sprint KPI Dashboard in Excel is designed to help teams monitor, evaluate, and optimize their performance during each sprint cycle. This ready-to-use template is perfect for teams looking to improve their project delivery by providing real-time insights and easy access to essential metrics.
Key Features of the Agile Sprint KPI Dashboard in Excel
This powerful Excel dashboard is built with user-friendliness and efficiency in mind. Below are the key features that make it an indispensable tool for any Agile team:
Home Sheet
The Home Sheet serves as the central hub of the dashboard, providing easy navigation with six buttons that jump to each respective sheet. This makes accessing various parts of the dashboard a breeze.
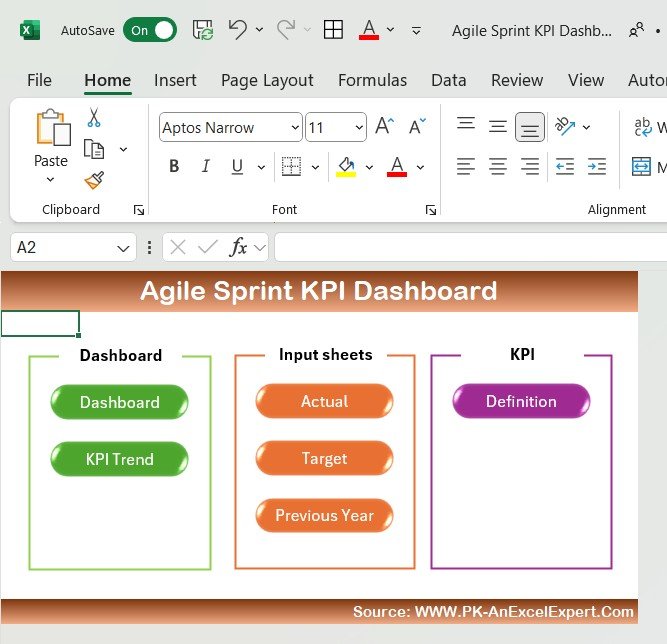
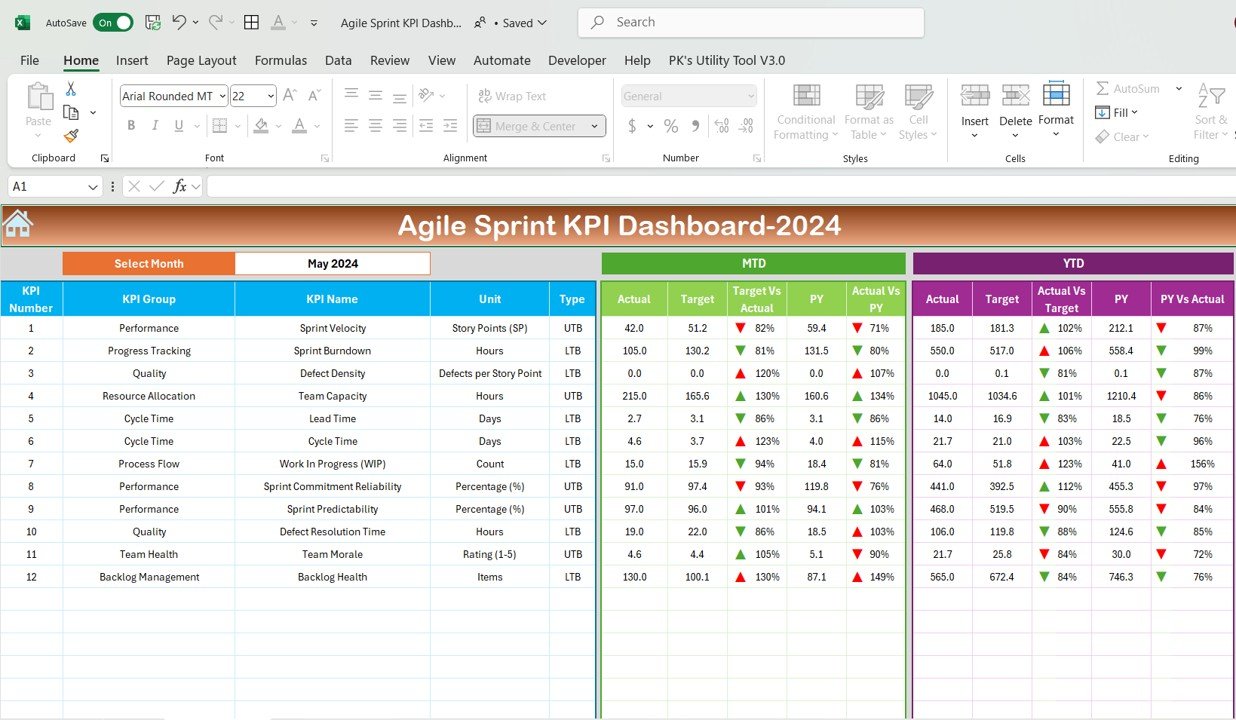
Dashboard Sheet Tab
The main tab where all KPI information is displayed. The dashboard allows users to:
- Select the month using a dropdown (Range D3) to view the MTD (Month-to-Date) and YTD (Year-to-Date) metrics.
- Compare actual performance with targets and previous year data, along with conditional formatting (up and down arrows).
KPI Trend Sheet Tab
A dynamic sheet where users can select a specific KPI from a dropdown (Range C3) and view detailed information, such as:
- KPI Group
- Unit of the KPI
- Formula for the KPI
- Type (whether Lower is Better or Upper is Better)

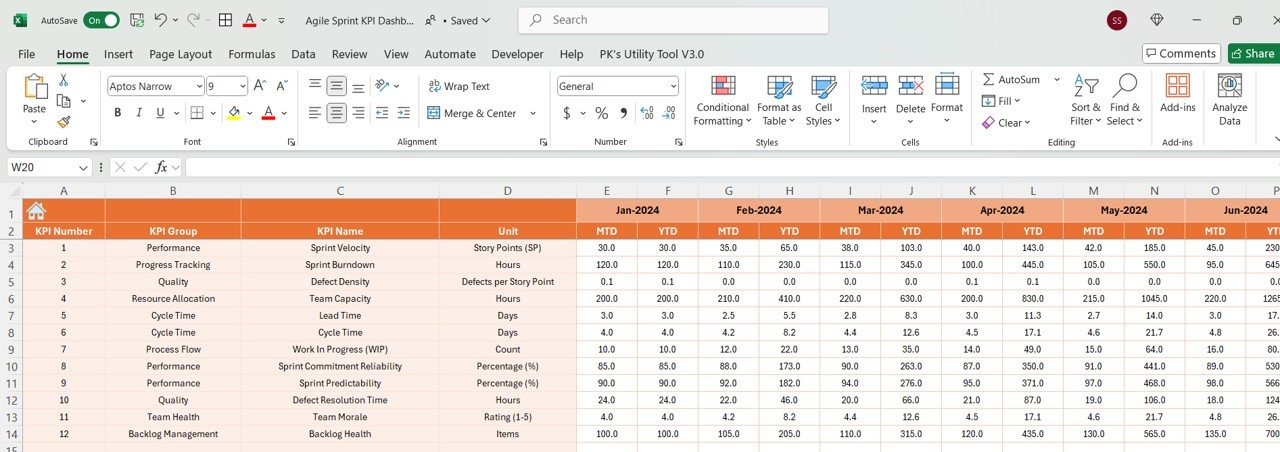
Actual Number Sheet Tab
Here, users enter the actual numbers for MTD and YTD for a specific month. The month can be changed from Range E1 to reflect updated data.
Target Sheet Tab
This sheet allows users to input target values for each KPI, both MTD and YTD. These targets are crucial for evaluating team performance.

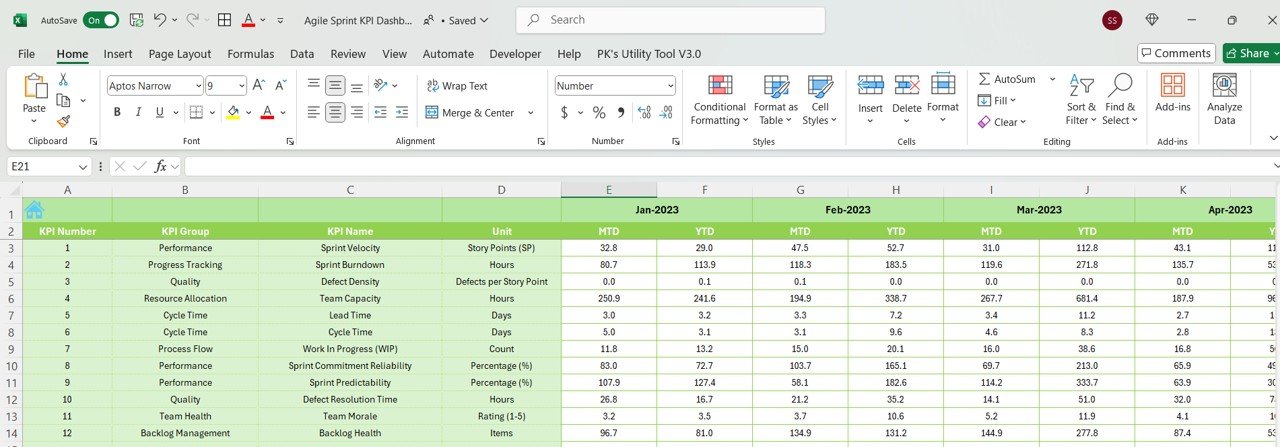
Previous Year Number Sheet Tab
Compare the current year’s performance with the previous year’s data, offering valuable insights into trends and improvements.
KPI Definition Sheet Tab
This sheet provides detailed definitions and formulas for each KPI, helping users fully understand the significance of the metrics being tracked.